RNAProbe - a web server for normalization and analysis of RNA structure probing data. You can take a (quick) NAP, while we analyze your data :)
Tutorial
How to use:
The RNAProbe server has four main modes of analysis:
- SHAPE Mode
- analysis of SHAPE reactivities with the standard normalization protocol or using user-provided normalized reactivities.
- DMS Mode
- analysis of DMS reactivities with the standard normalization protocol or using user-provided normalized reactivities.
- CMCT Mode
- analysis of CMCT reactivities with the standard normalization protocol or using user-provided normalized reactivities.
- Prediction Mode
- prediction of RNA secondary structure by various predictors; the consensus of predictions is visualized.
1. SHAPE Mode
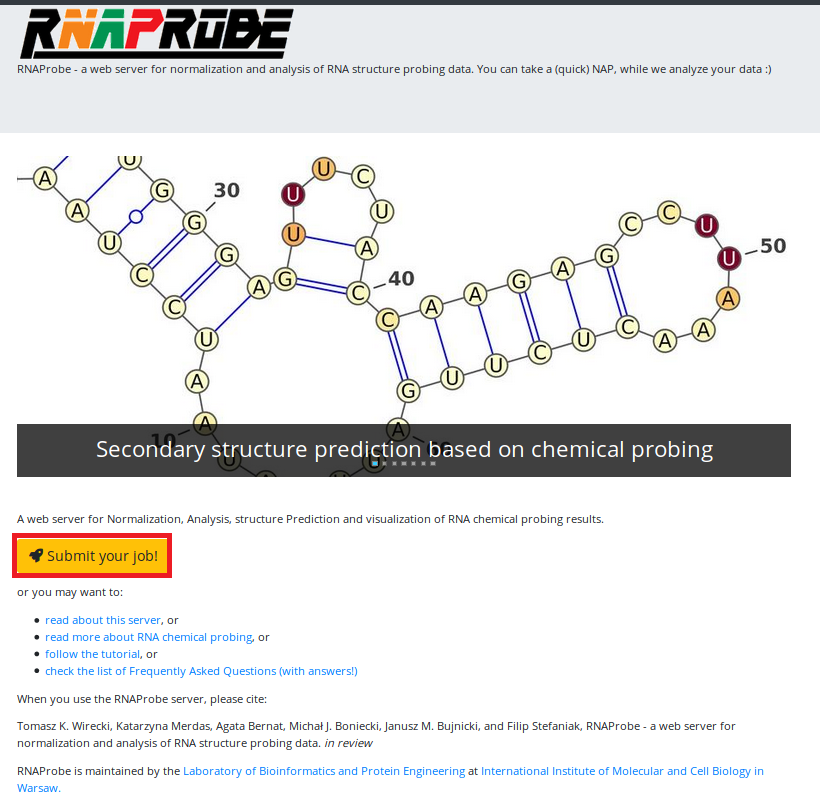
In order to do analysis in the SHAPE Mode, on the main page hit the
(marked in the red box), and you will be redirected to a job upload site.
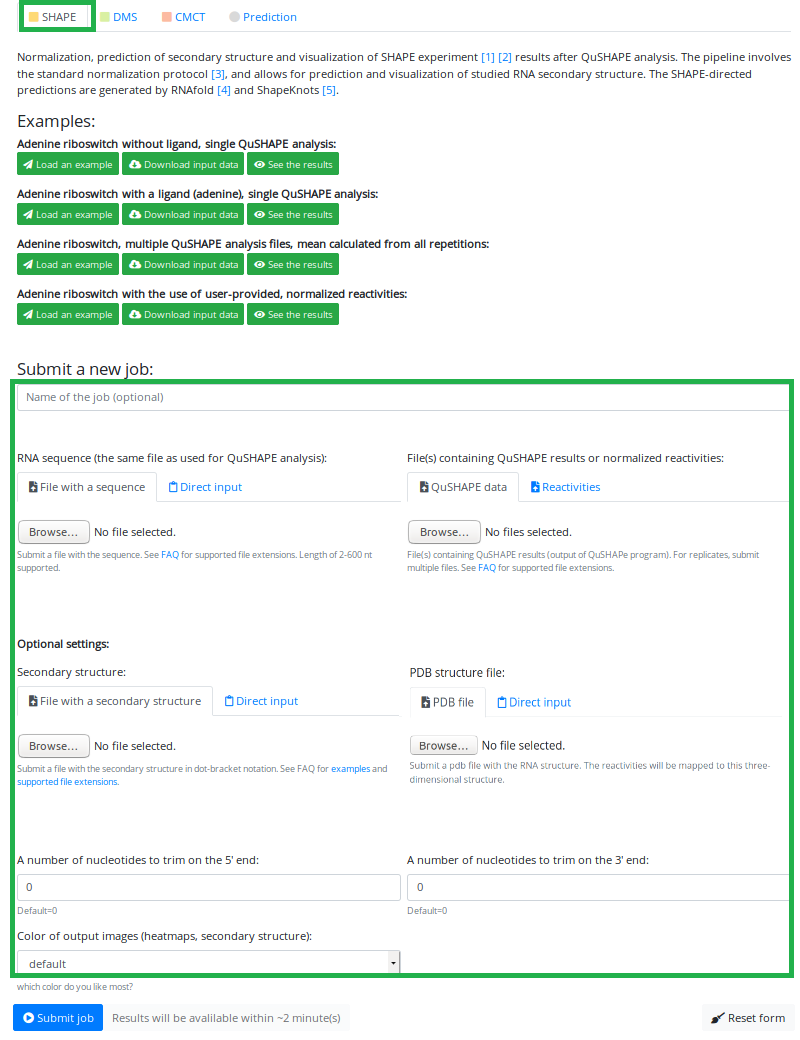
To perform analysis in SHAPE Mode, make sure that you have chosen the right mode by clicking the SHAPE button
just below the text "Analysis mode:" (marked in the small green box).
Here you can see all the options available for the SHAPE Mode analysis (marked in the green box), which are:
- name of the job (optional)
- file upload/pasting for sequence and QuShape/reactivities files
- file upload/pasting for user-provided secondary structure
- file upload/pasting for user provided PDB
- specifying the number of nucleotides at the 5' and 3' end to be trimmed
- color options
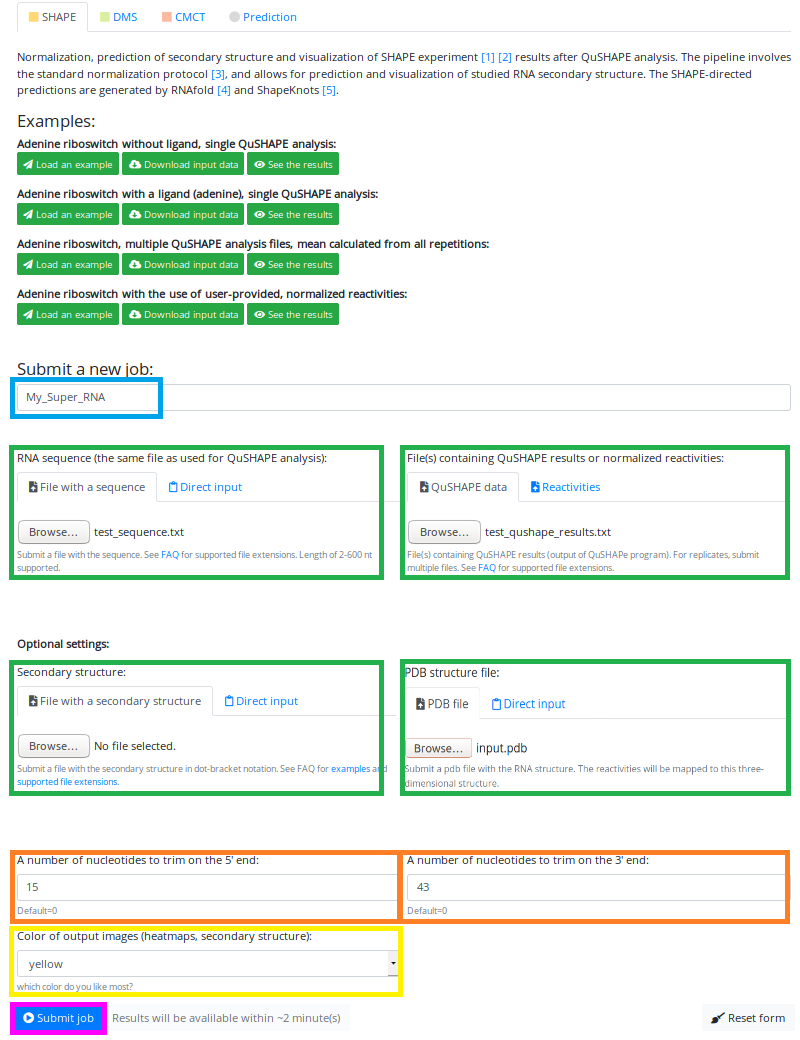
We have entered the name of our job - "My_super_RNA" (marked in the blue box)
Uploaded sequence file - "test_sequence.txt" and QuShape results file - "test_qushape_results.txt" (marked in green boxes)
Specified the number of nucleotides to be trimmed - 15 on 5' and 43 on 3' ends (marked in orange boxes)
And chose color of output - yellow (marked in the yellow box).
This time we decided that we will not input user-provided secondary structure (left green box below sequence input)
But instead, we decided that we upload a PDB with the structure of our RNA, so we can check how the reactivities are mapped on the structure!
Now we are ready to hit the "Submit job" button:
(marked in magenta box).
The estimated time for the job to finish is printed on the right side of the Submit button.
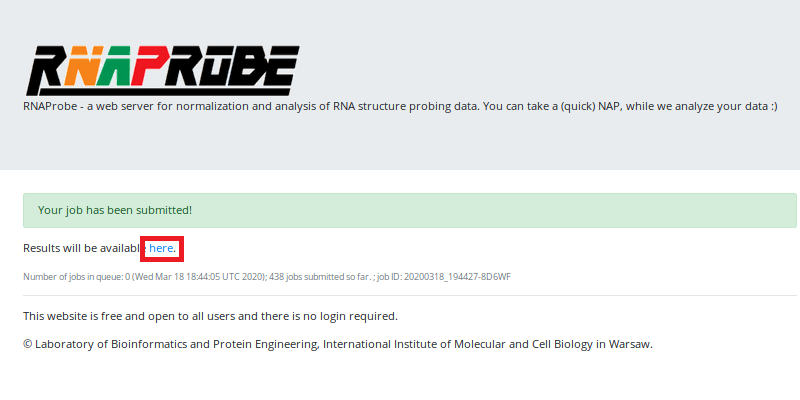
You will see the notification that your job has been successfully submitted and a link to your results (marked in the red box).
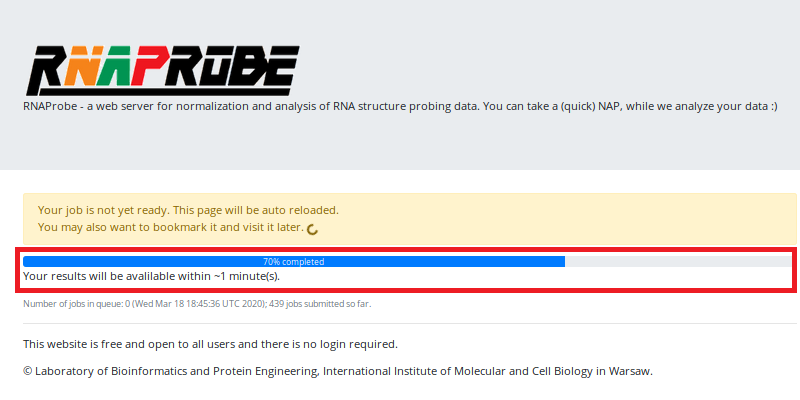
If you follow the link, you will be redirected to the site with a progress bar (marked in the red box), which will be automatically reloaded until the results are ready. Now it is the time to take a (quick) nap or drink a cup of coffee . The time you have for a nap/coffee is estimated under the progress bar.
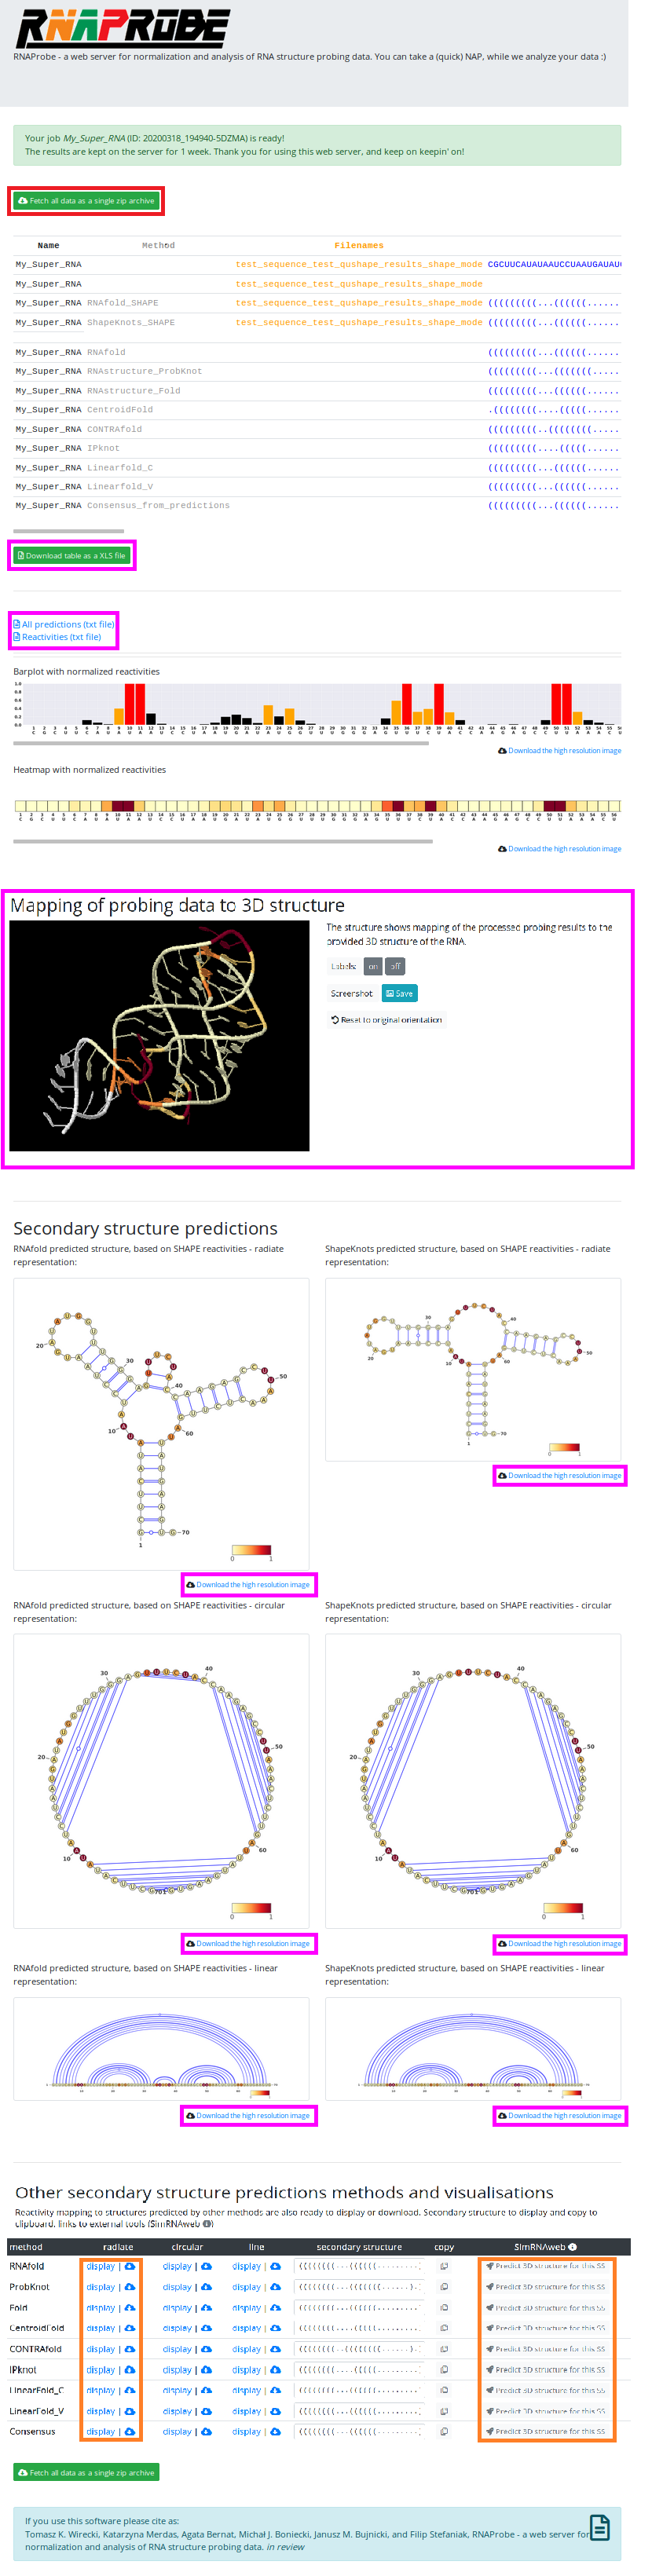
After your results are ready, you will see the page with all results. There you can download all results in a single zip archive (marked in the red box), or browse them on the site and download only specific outputs (marked in the magenta boxes).
In the SHAPE Mode, the results page contains:
- scrollable table with all results
- barplot and heatmap for the analyzed sequence reactivities values
- 3D structure with mapped reactivities - sooo cool!
- VARNA representation of SHAPE directed secondary structure predictions
- links to textfiles with predictions
- table, where, by clicking specific buttons you can view/download , non-probing-directed predictions (marked in orange box)
- and finally buttons to send the predictions to SimRNAweb server, which will predict 3d structure especially for you ;)
2. DMS / CMCT Mode
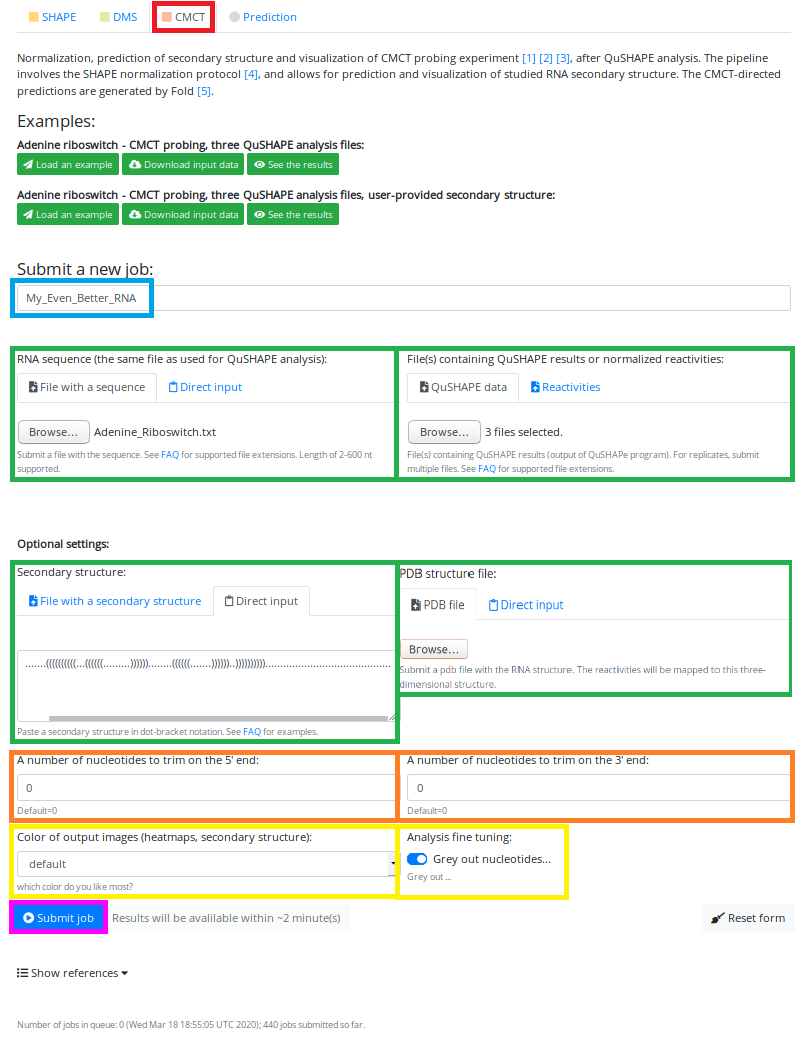
To access DMS/CMCT Mode, you have to click on the button "DMS"/"CMCT" just below the text "Analysis mode" (marked in the red box):
or
The upload page is very similar to the SHAPE Mode, with addition of "grey out" toggle button (allows for graying out the nucleotides that should not be probed during the experiment).
The main change between the SHAPE and DMS/CMCT modes will be visible on the results page (we will get there soon, do not worry).
We have entered the name of our job - "My_Even_Better_RNA" (marked in the blue box).
Uploaded the sequence file - "test_sequence.txt" and three QuHSPE files (which will be averaged)(marked in green boxes).
This time we choose to paste secondary structure into the "Secondary Structure" box, in order to get the reactivities mapped on the provided structure (green box below the "sequence upload").
We do not want to see the 3D structure with mapped reactivities, today is not the day.
We do not trim the sequence (orange boxes), and we do not choose any custom color (the default for CMCT analysis is red) (left yellow box)
We also have toggled the "grey out" button to ON, so all Cs and As will not be colored in reddish (they will be grey, what a surprise :) )
Now we are ready to hit the "Submit job" button (marked in magenta box):
The estimated time for the job to finish is printed on the right side of the Submit button.
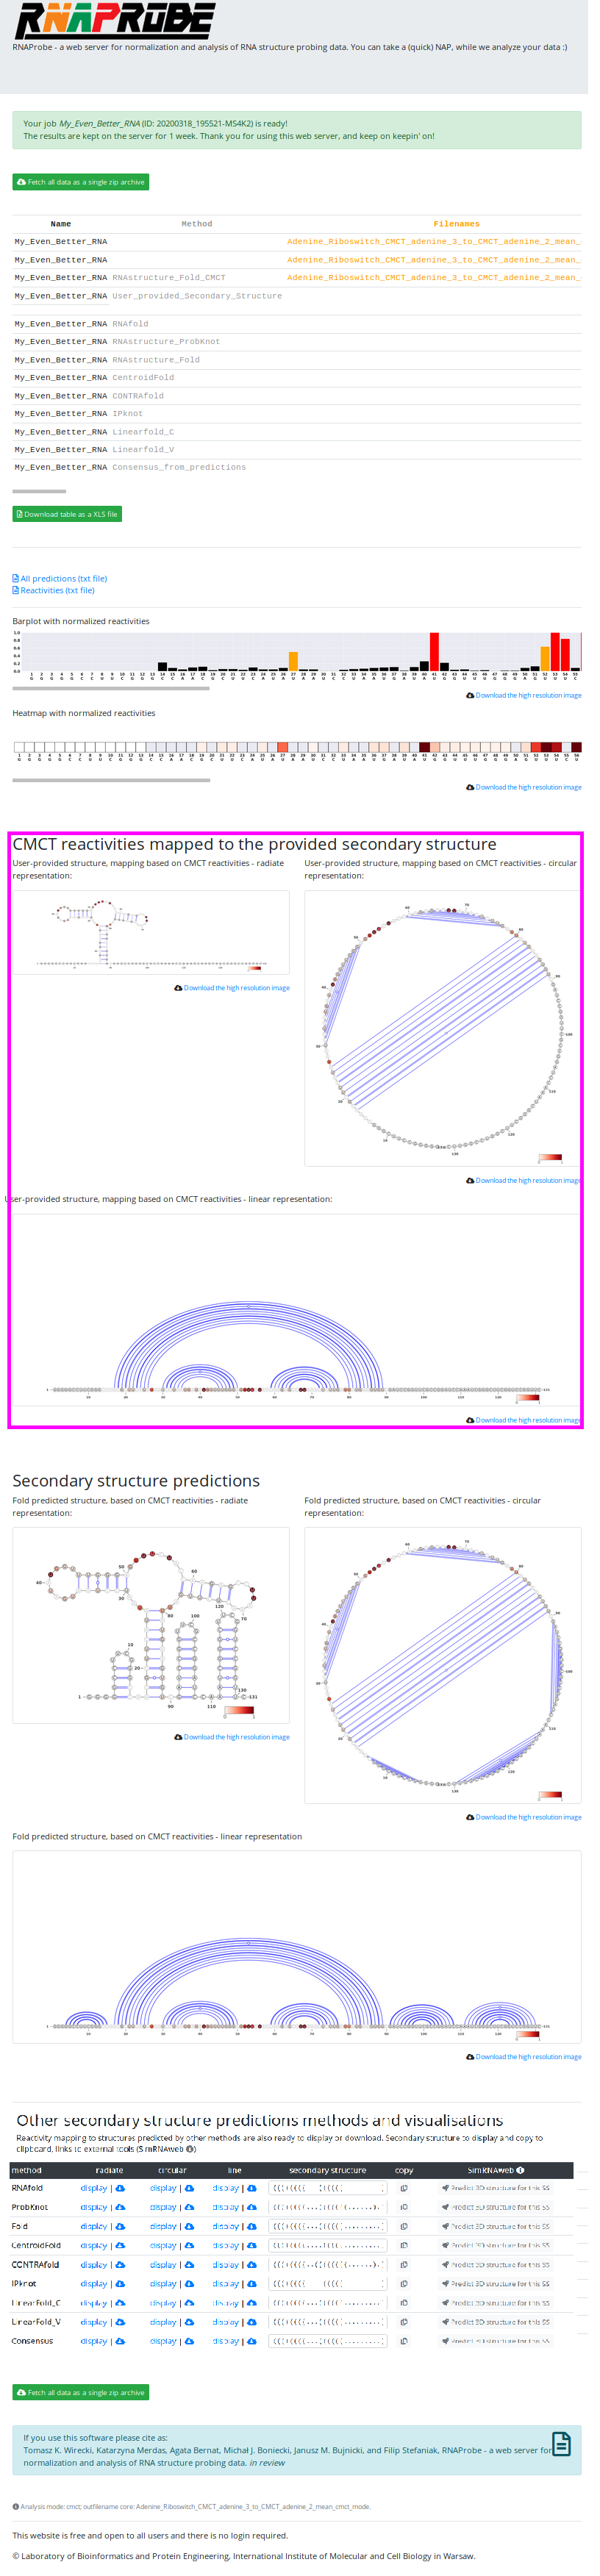
After the job is finished, you can view all the results on a very similar results page as in the SHAPE Mode. The main difference is the fact that instead of RNAfold and ShapeKnots predictions, we will see Fold Probing-guided predictions (due to the fact that the two former methods do not have an option to use DMS/CMCT reactivities)
Here, again, you can download all results in a single zip archive, or browse them on the site and download only specific outputs.
NOTE, that before the Fold predictions, we can see the reactivities mapped on the provided secondary structure (magenta box). Also, note that As and Cs are GREY.
In the DMS/CMCT Mode the results page contains:
- scrollable table with all results
- barplot and heatmap for the analyzed sequence reactivities values
- VARNA representation of Probing-directed secondary structure predictions
- links to textfiles with predictions
- table, where, by clicking specific buttons you can view/download , non-probing-directed predictions (marked in orange box)
- and again, buttons to send the predictions to SimRNAweb server
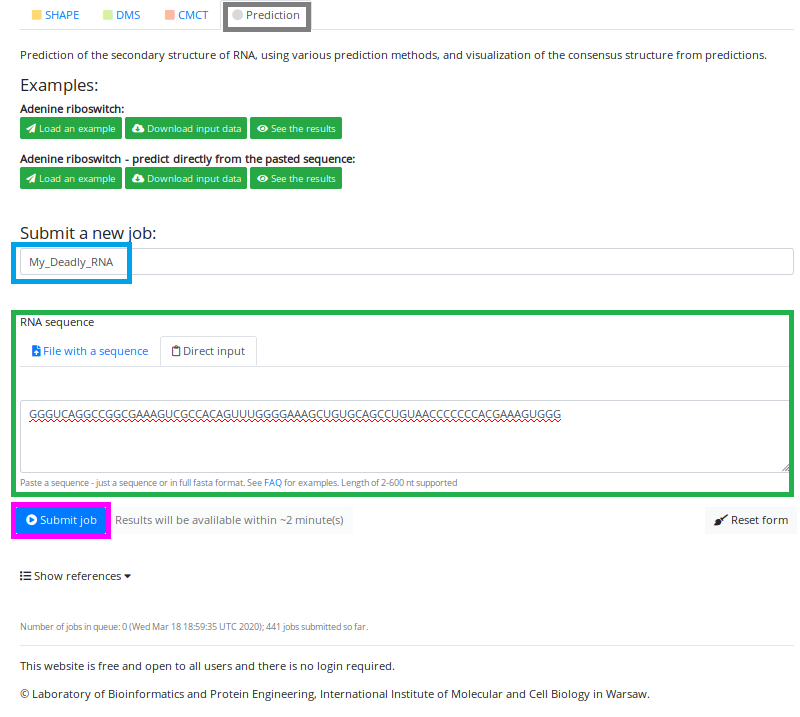
3. Prediction Mode
To access the Prediction Mode, you have to click on the button "Prediction" just below the text "Analysis mode" (marked in the grey box):
The upload page is very similar to the previous modes; however, note that now only two options are available: "name of the job" and "sequence upload".
In the Prediction Mode, you can upload/paste only the sequence, and the prediction will be performed by various prediction tools.
We have entered the name of our job - "My_Deadly_RNA" (marked in the blue box). First, who guess why "Deadly" gets a chocolate bar!
And pasted the sequence into the "Direct input" box (marked in the green box).
Now we are ready to hit the "Submit job" button (marked in the magenta box):
The estimated time for the job to finish is printed on the right side of the Submit button.
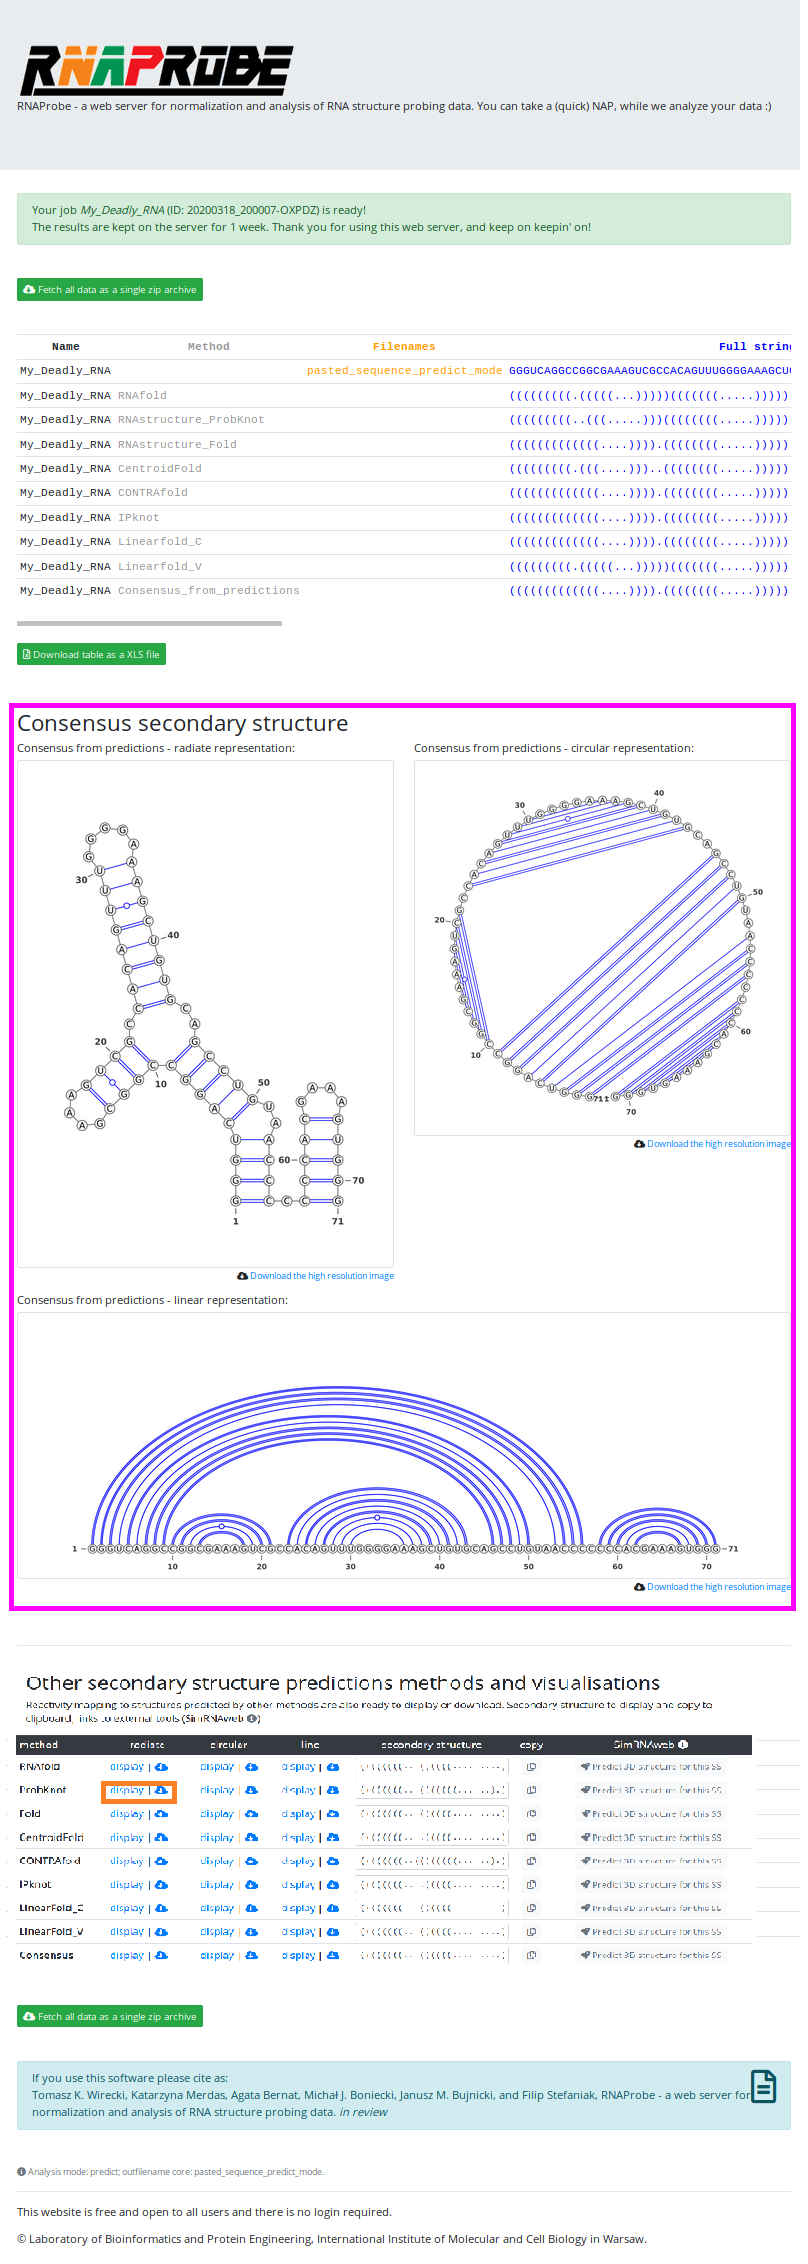
After the job is finished, you can view all the results on a very similar result page as in the other modes. There you can download all results in a single zip archive, or browse them on the site and download only specific outputs.
Note that this time, however, there is less output to browse and download.
The structures viewed on the page, are the VARNA representations of the structure for consensus from all employed prediction methods (magenta box).
In the Prediction Mode, the results page contains:
- scrollable table with all results
- VARNA representation for consensus structure from all secondary structure predictions
- links to textfiles with predictions
- table, where, by clicking specific buttons you can view/download , non-probing-directed predictions
- and again, buttons to send the predictions to SimRNAweb server
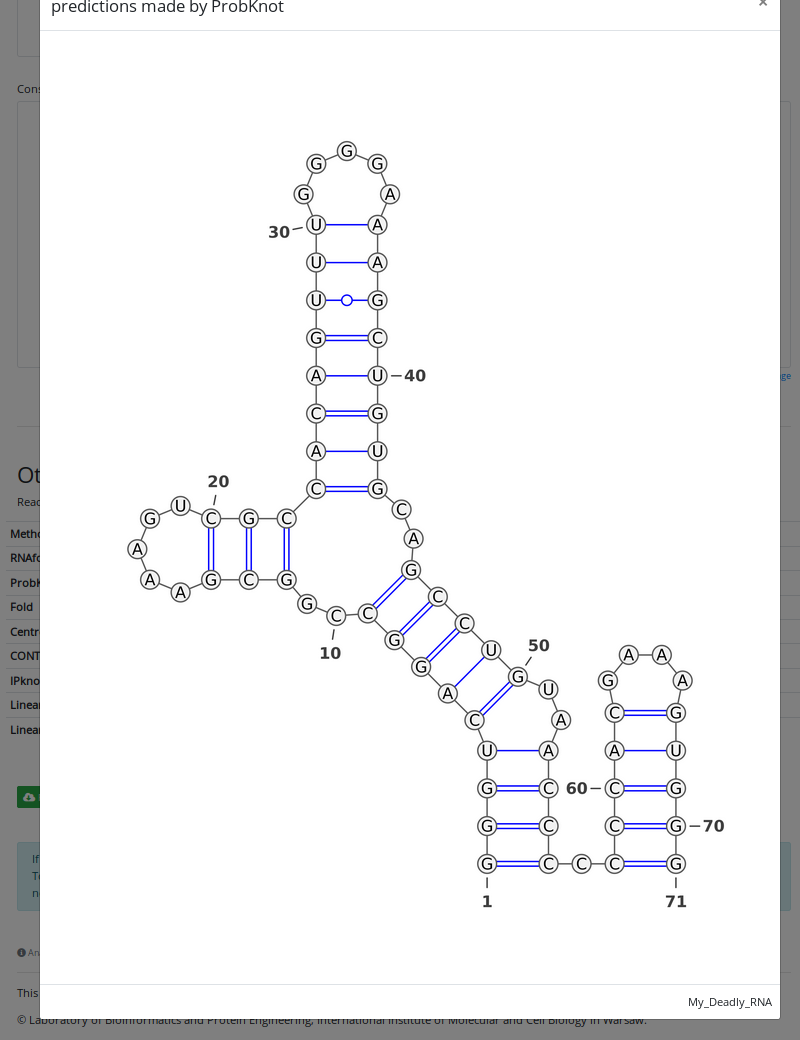
In the orange box, ProbKnot prediction button is highlighted. And if we hit that button, the structure predicted by ProbKnot will pop-up on the screen.
You may also want to check the other predictions (go on, I know you want it :) ).
And here, you can see how the pop-upped structure looks like. Enjoy!
Description of inputs:
1. Sequence
The sequence file is a text file containing the sequence of RNA, ideally, the same file as used in the QuShape analysis. The sequence can also be pasted directly. The format of the file is as follows:
sequence.txt ( see the sample sequence file)
GGGCCUUCGGGCCAACGCUUCAUAUAAUCCUAAUGAUAUGGUUUGGGAGUUUCUACCAAGAGCCUUAAACUCUUGAUUAUGAAGUGUCGAUCCGGUUCGCCGGAUCCAAAUCGGGCUUCGGUCCGGUUC
The sequence may also be in the FASTA format.
2. QuShape results file
The QuShape results file is a text file (tab-delimited) generated as a result of the QuShape analysis. The format of the file is as follows:
QuShape.txt ( see the sample QuShape analysis file)
seqNum      seqRNA  posSeq  posRX   areaRX  posBG   areaBG  areaDiff        normDiff
7   U       956     944     11258.34        944     9638.54 1619.8  0.12
8   C       946     939     5221.6  938     5096.91 124.7   0.01
9   G       938     930     30072.11        930     5597.38 24474.72        1.76
10  G       931     920     14700.55        920     8996.24 5704.31 0.41
11  G       922     906     82235.32        906     95511.97        -13276.65       0.0
...
3. Reactivities file
The reactivities file is a text file with two columns, with a nucleotide number and its corresponding reactivity value. The format of the file is the same as used in the SHAPE directed predictions with RNAfold and ShapeKnots. The format of the file is as follows:
reactivities.txt (
see the sample reactivities file)
1 0.03
2 1.0
3 1.0
4 1.0
5 1.0
6 0.06
7 0.2
8 0.25
...
4. Secondary Structure
The secondary structure file is a text file containing the secondary structure of RNA in the dot-bracket notation, provided by the user in order to map reactivities to the structure. The structure can also be pasted directly. The format of the file is as follows:
structure.txt ( see the sample secondary structure file)
................((((((((((...((((((.........))))))........((((((.......))))))..))))))))))..........................................
5. PDB file
Standard PDB file. It would be nice if the molecule in teh file had the same sequence as the analyzed RNA :). The server checks if both sequences agrees, so if you are up to some mischief, the consequences may be unpredictable :)
Description of outputs:
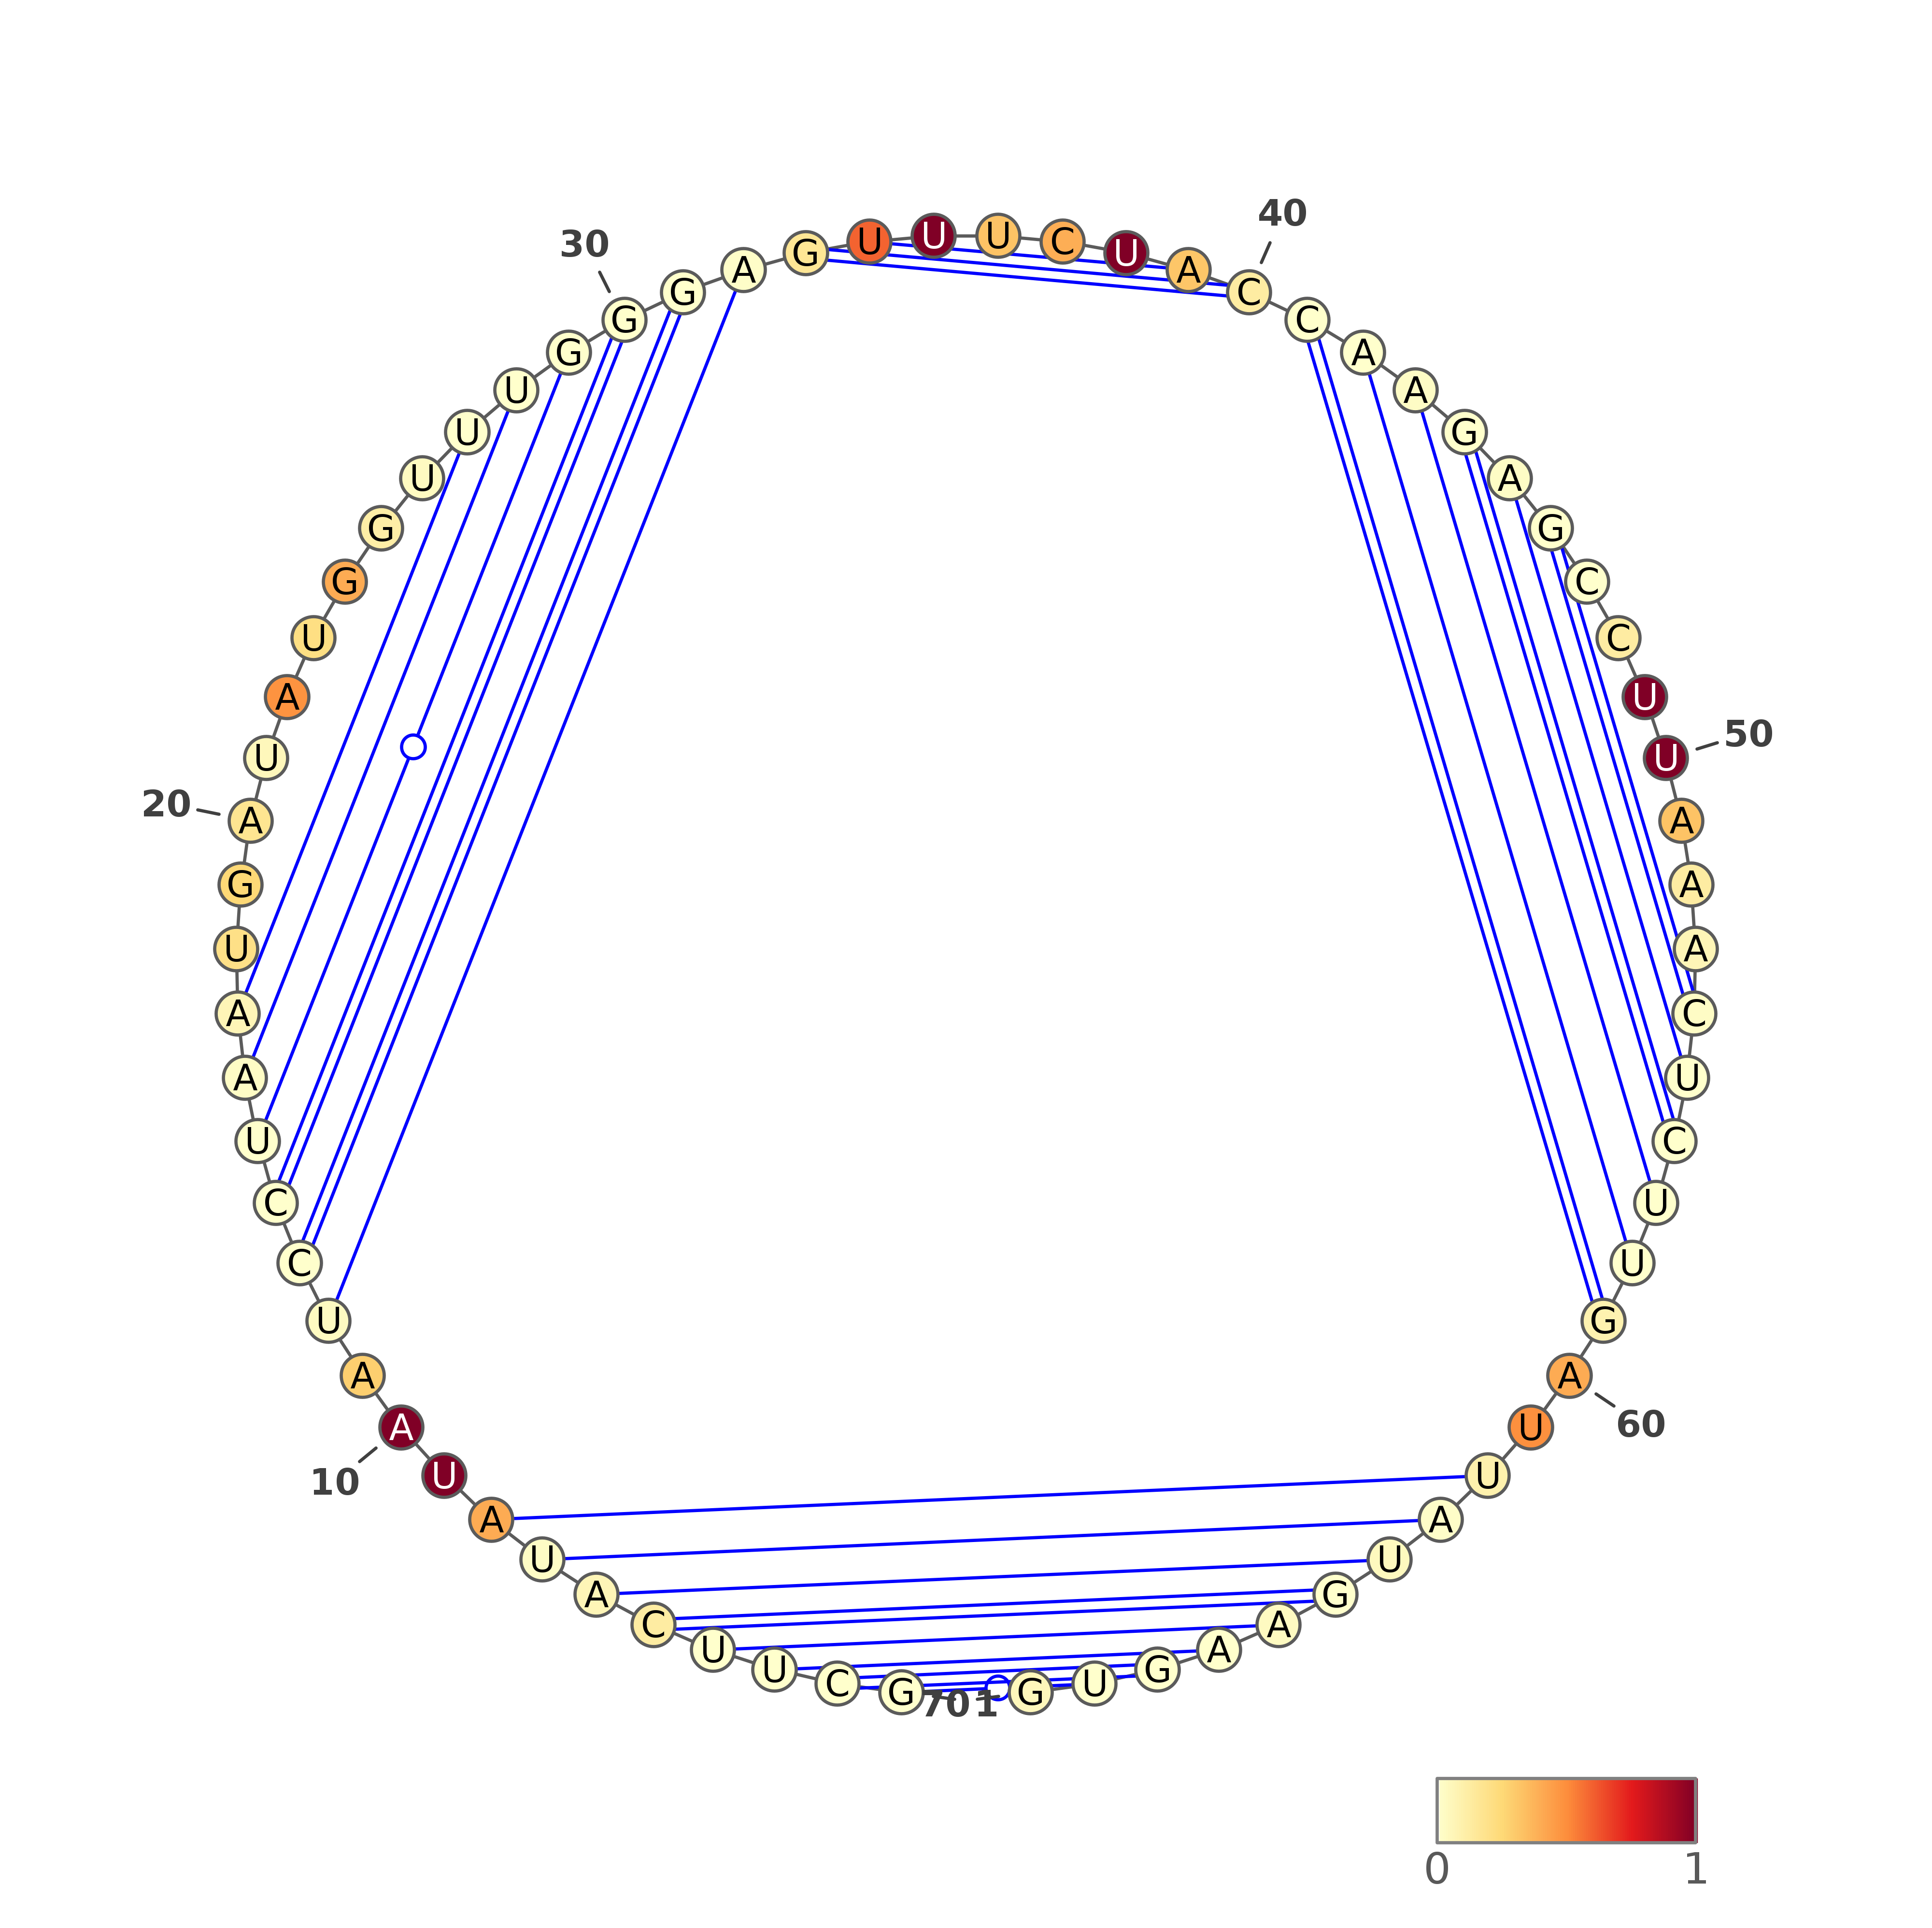
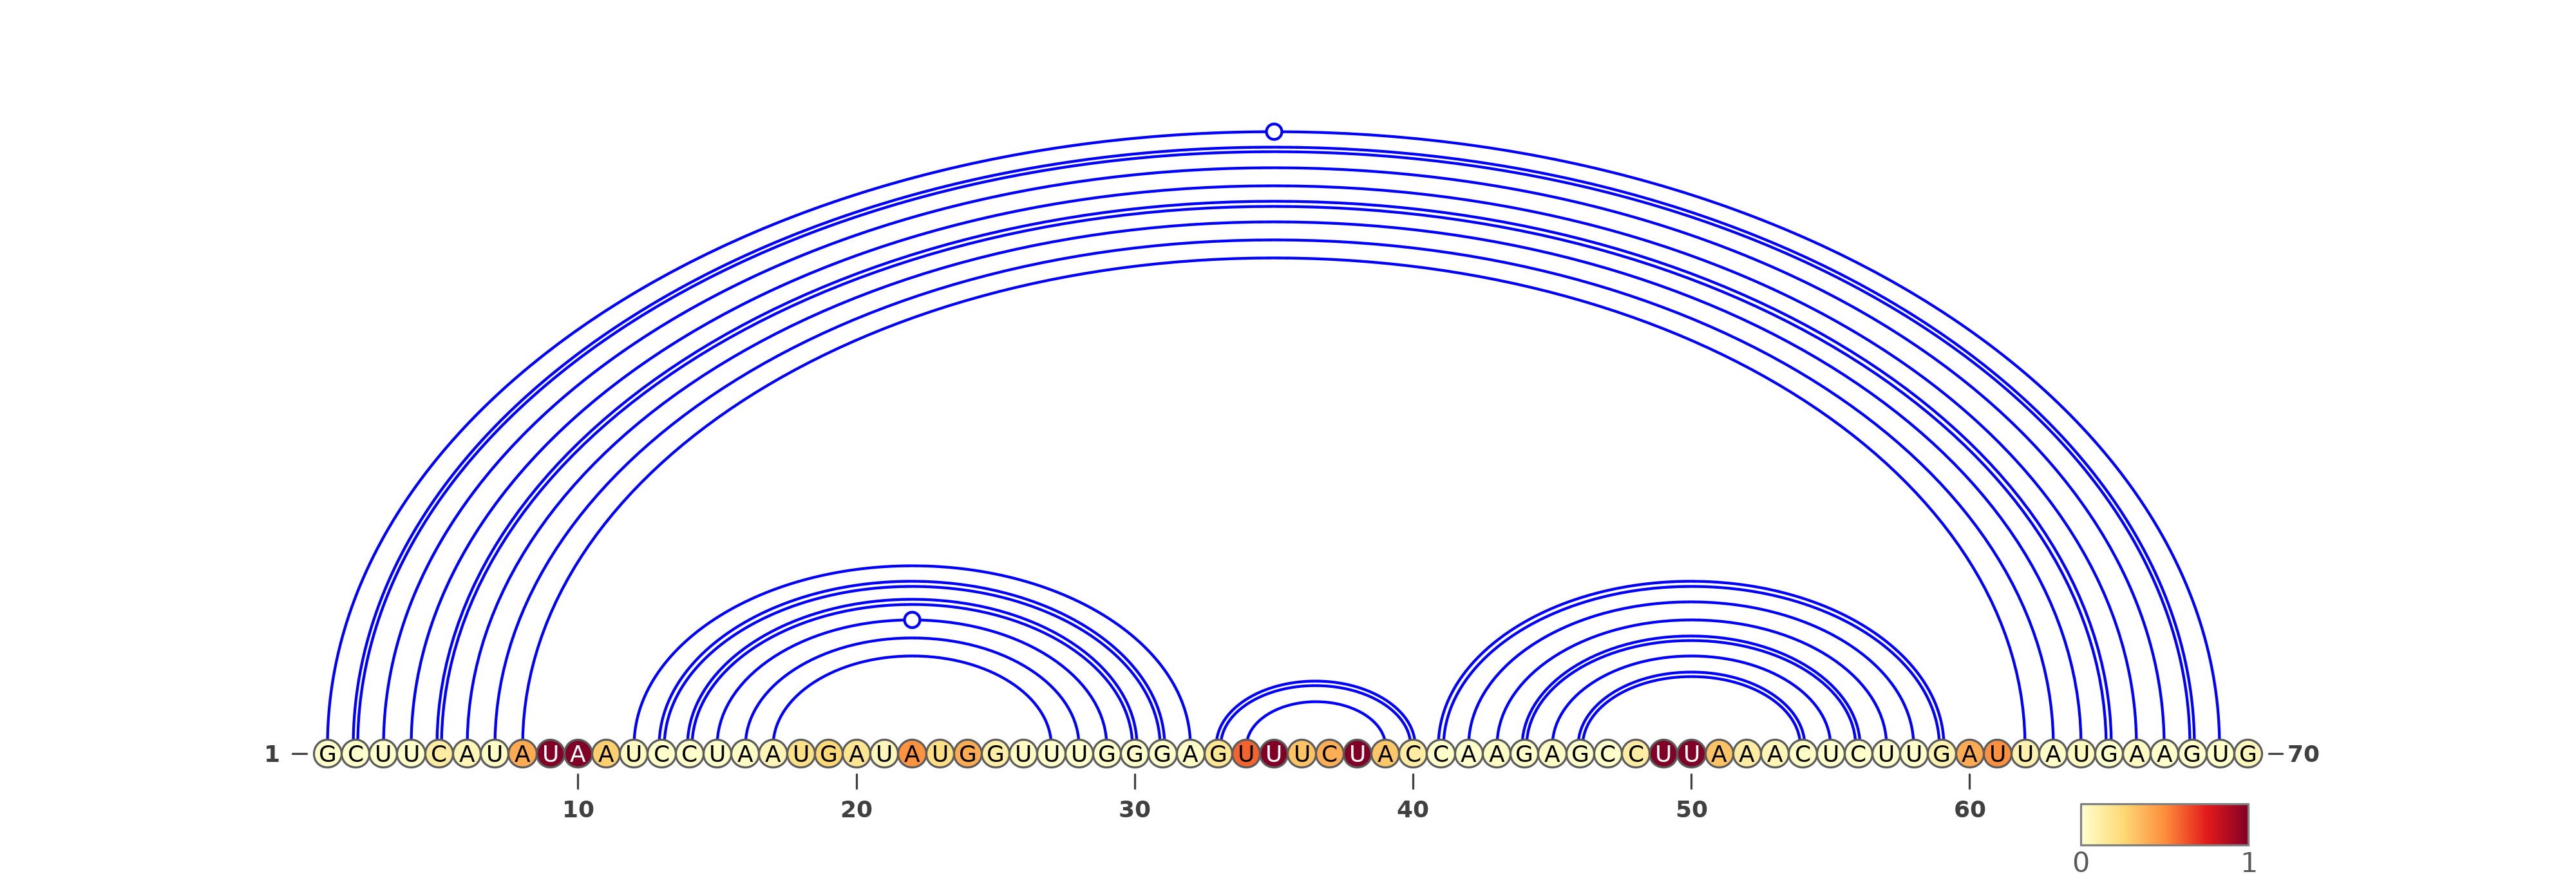
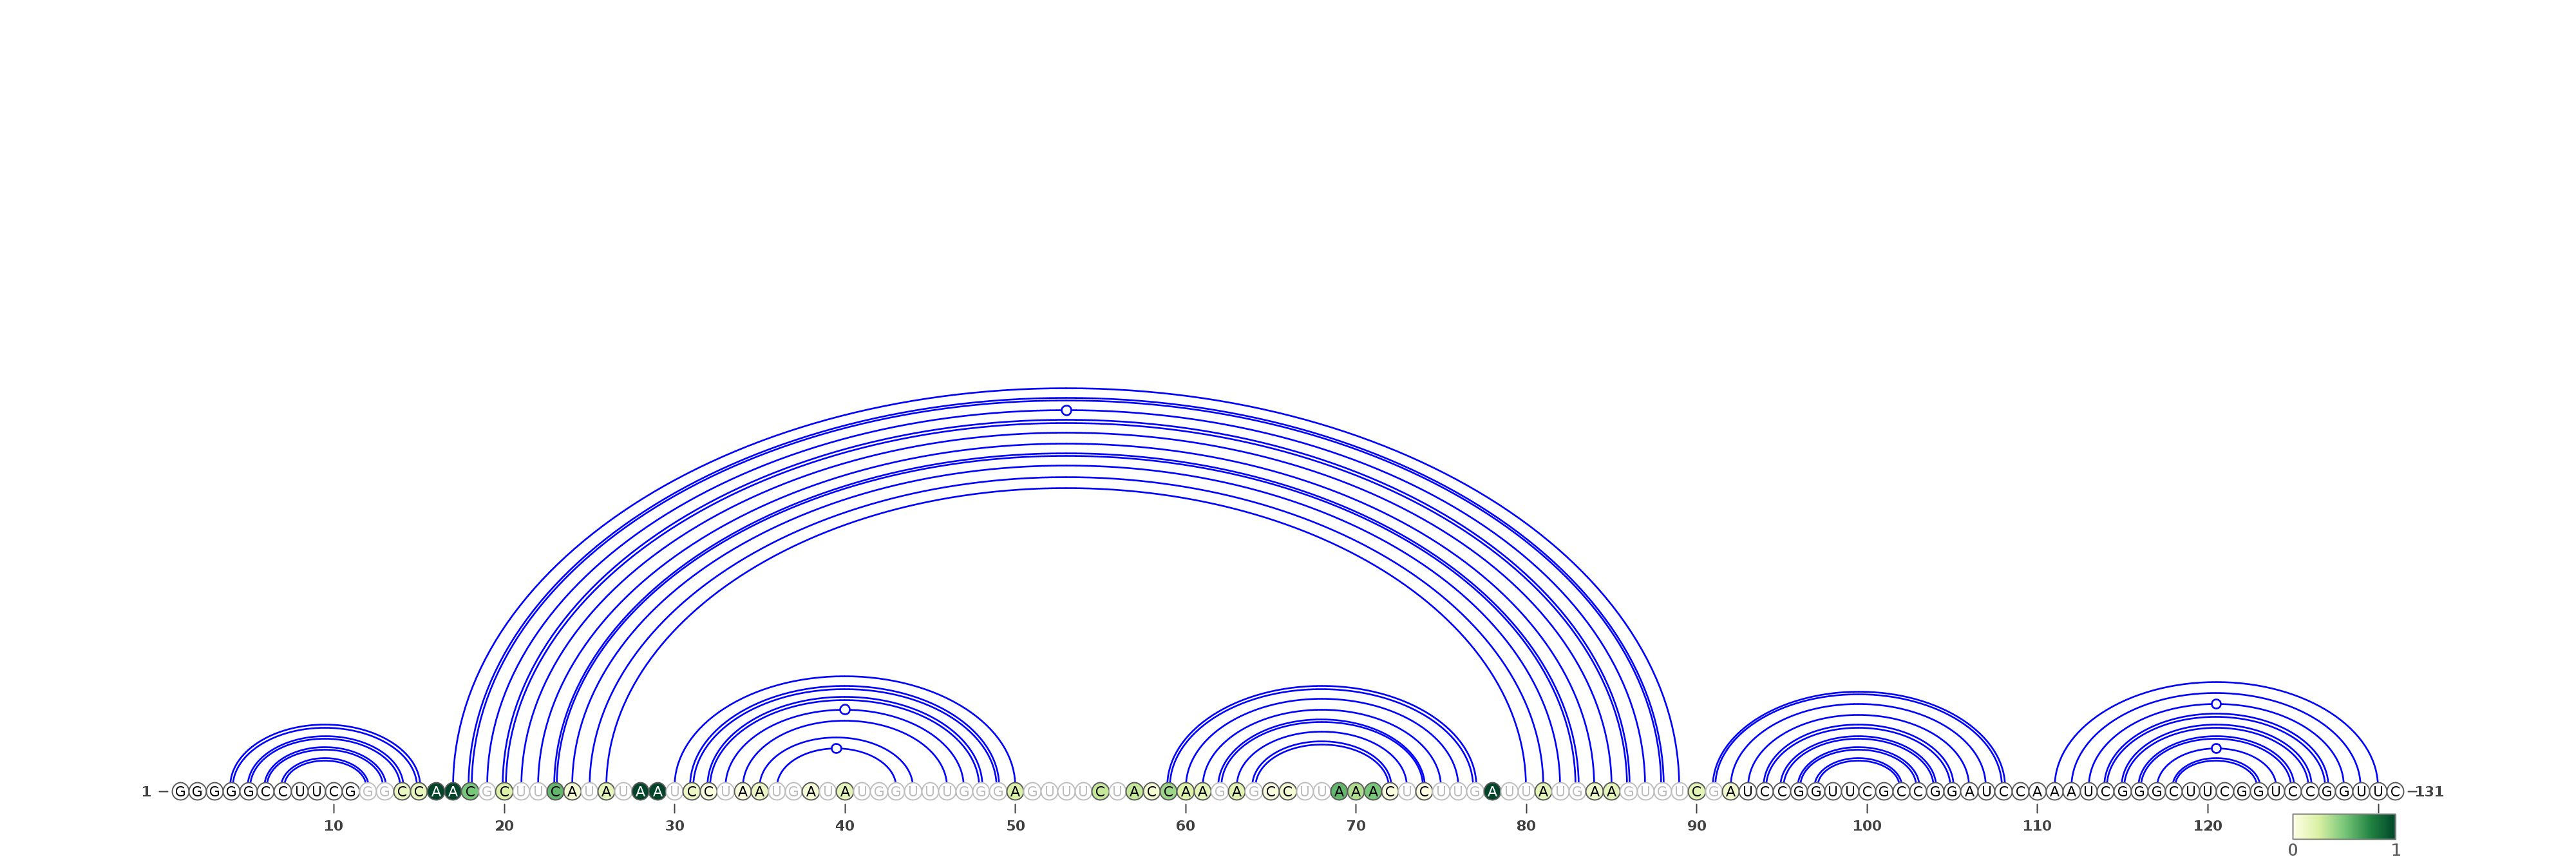
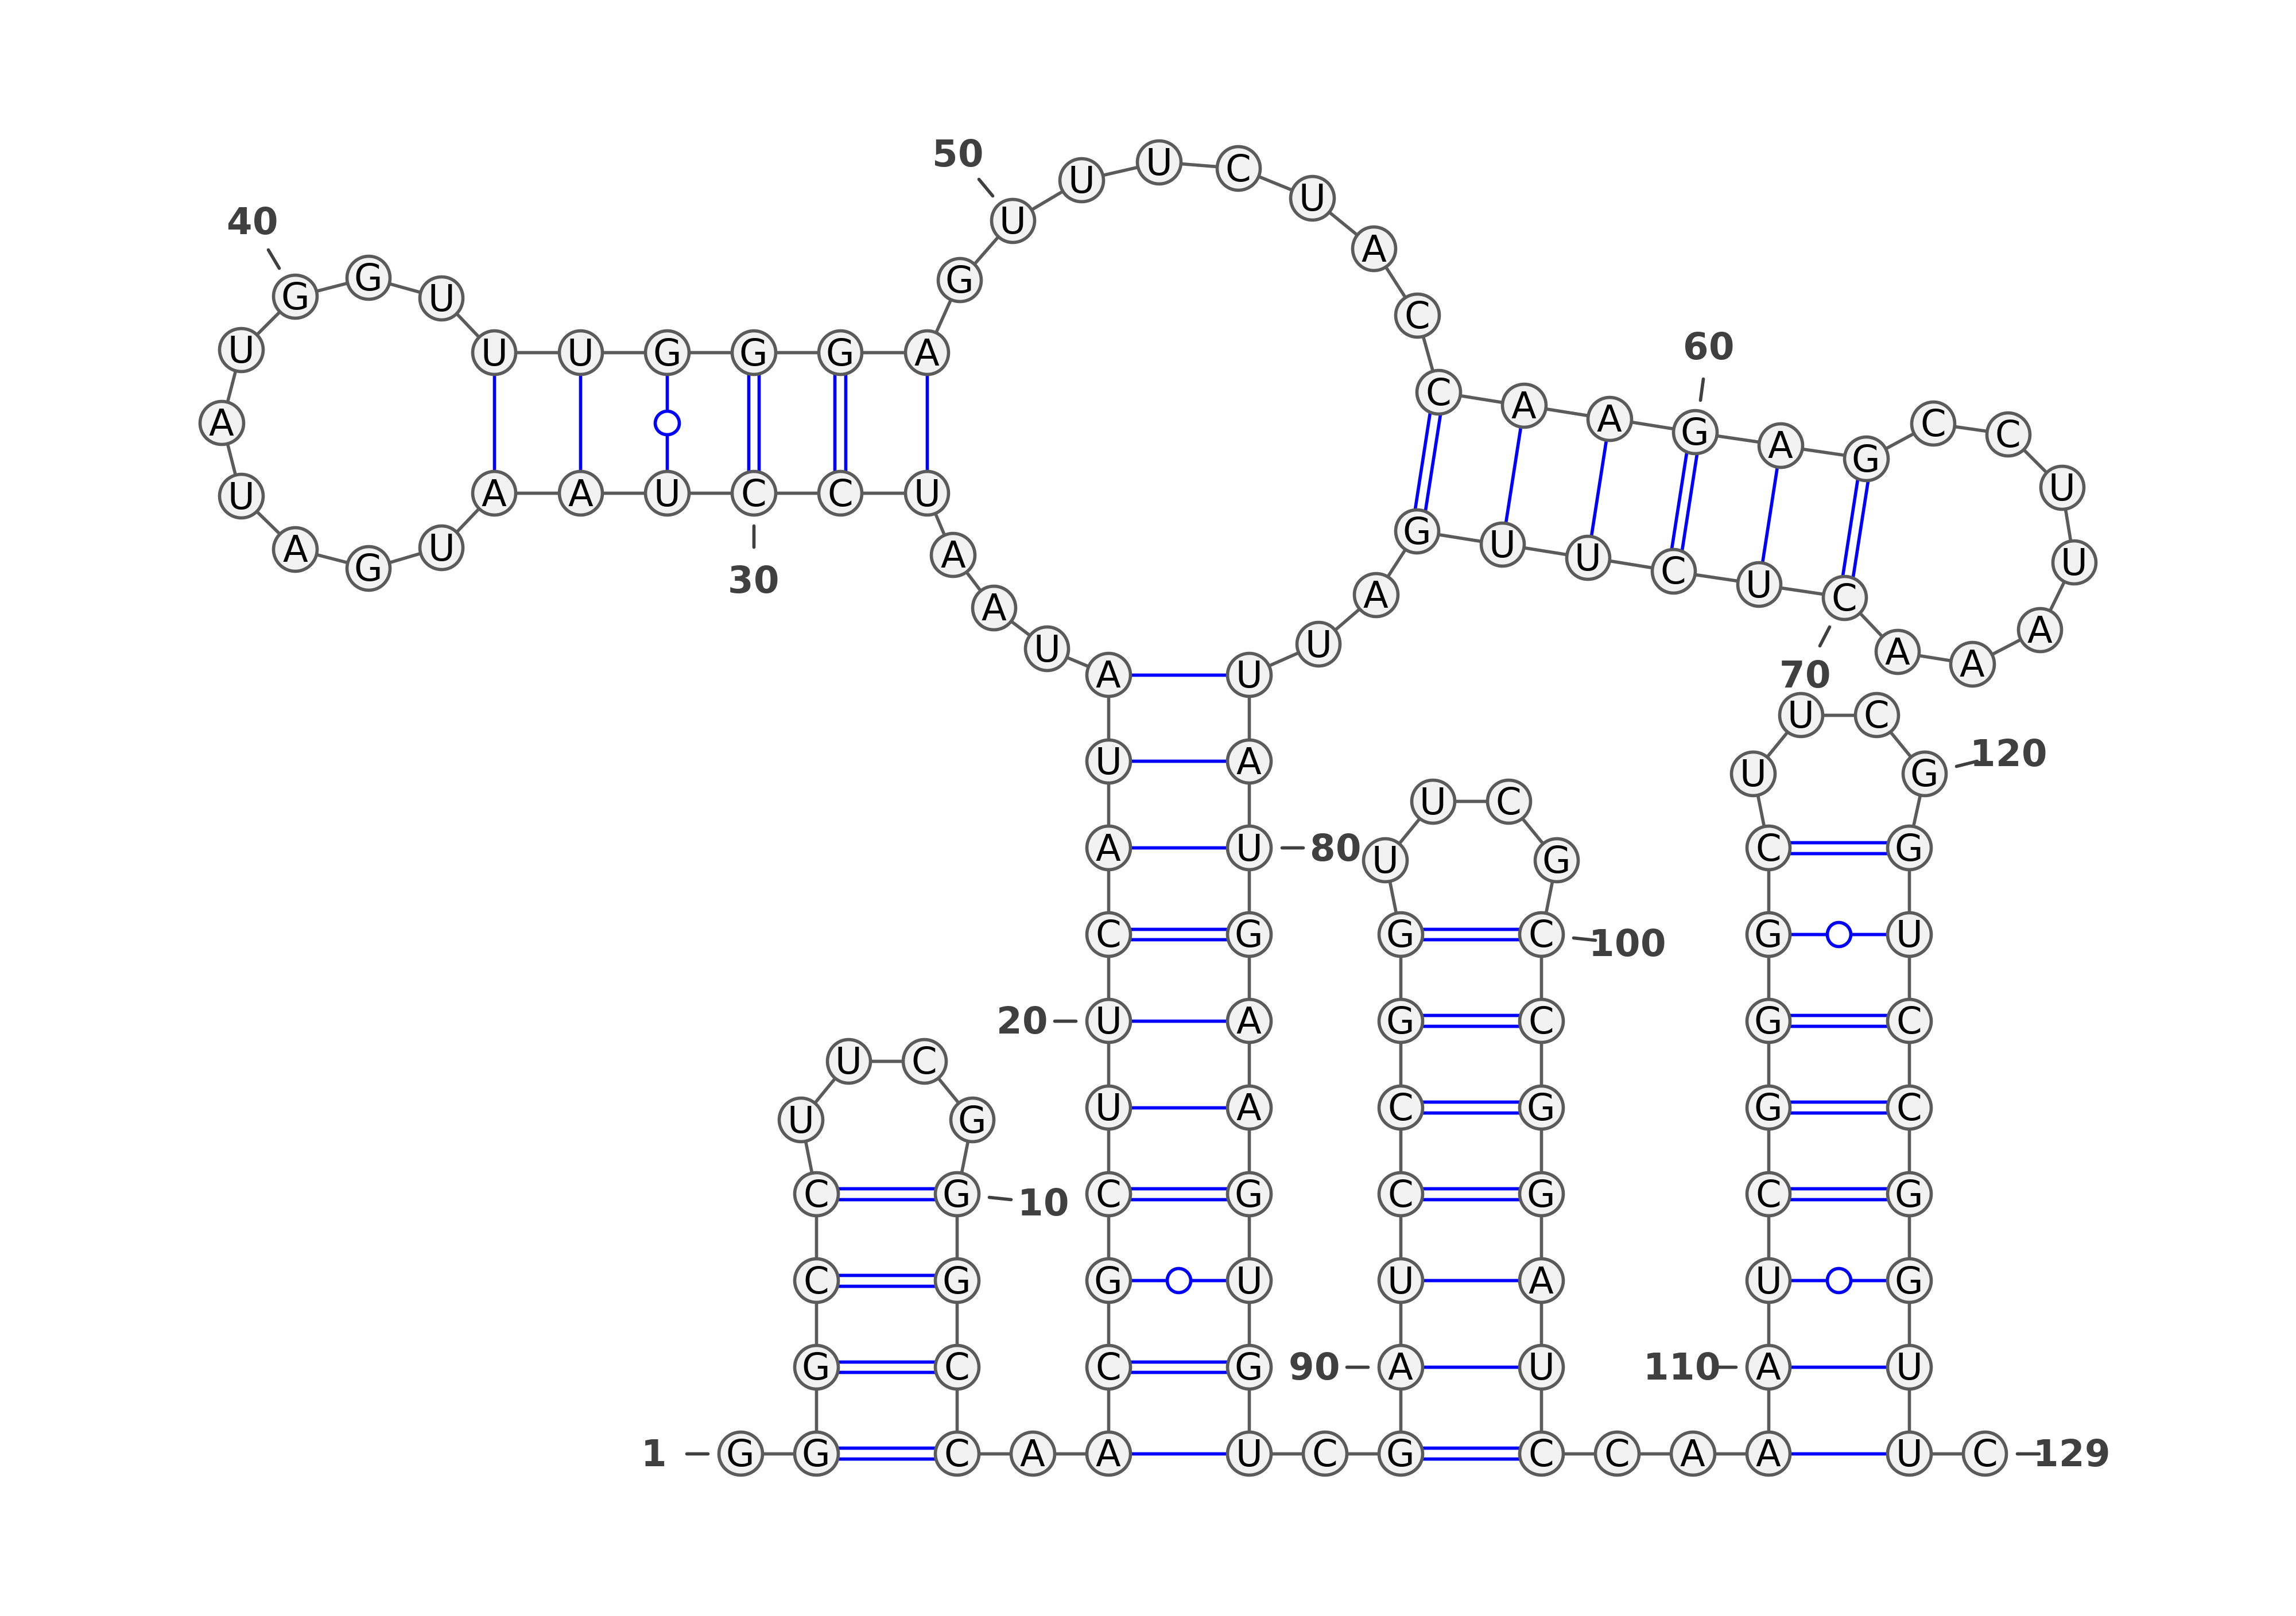
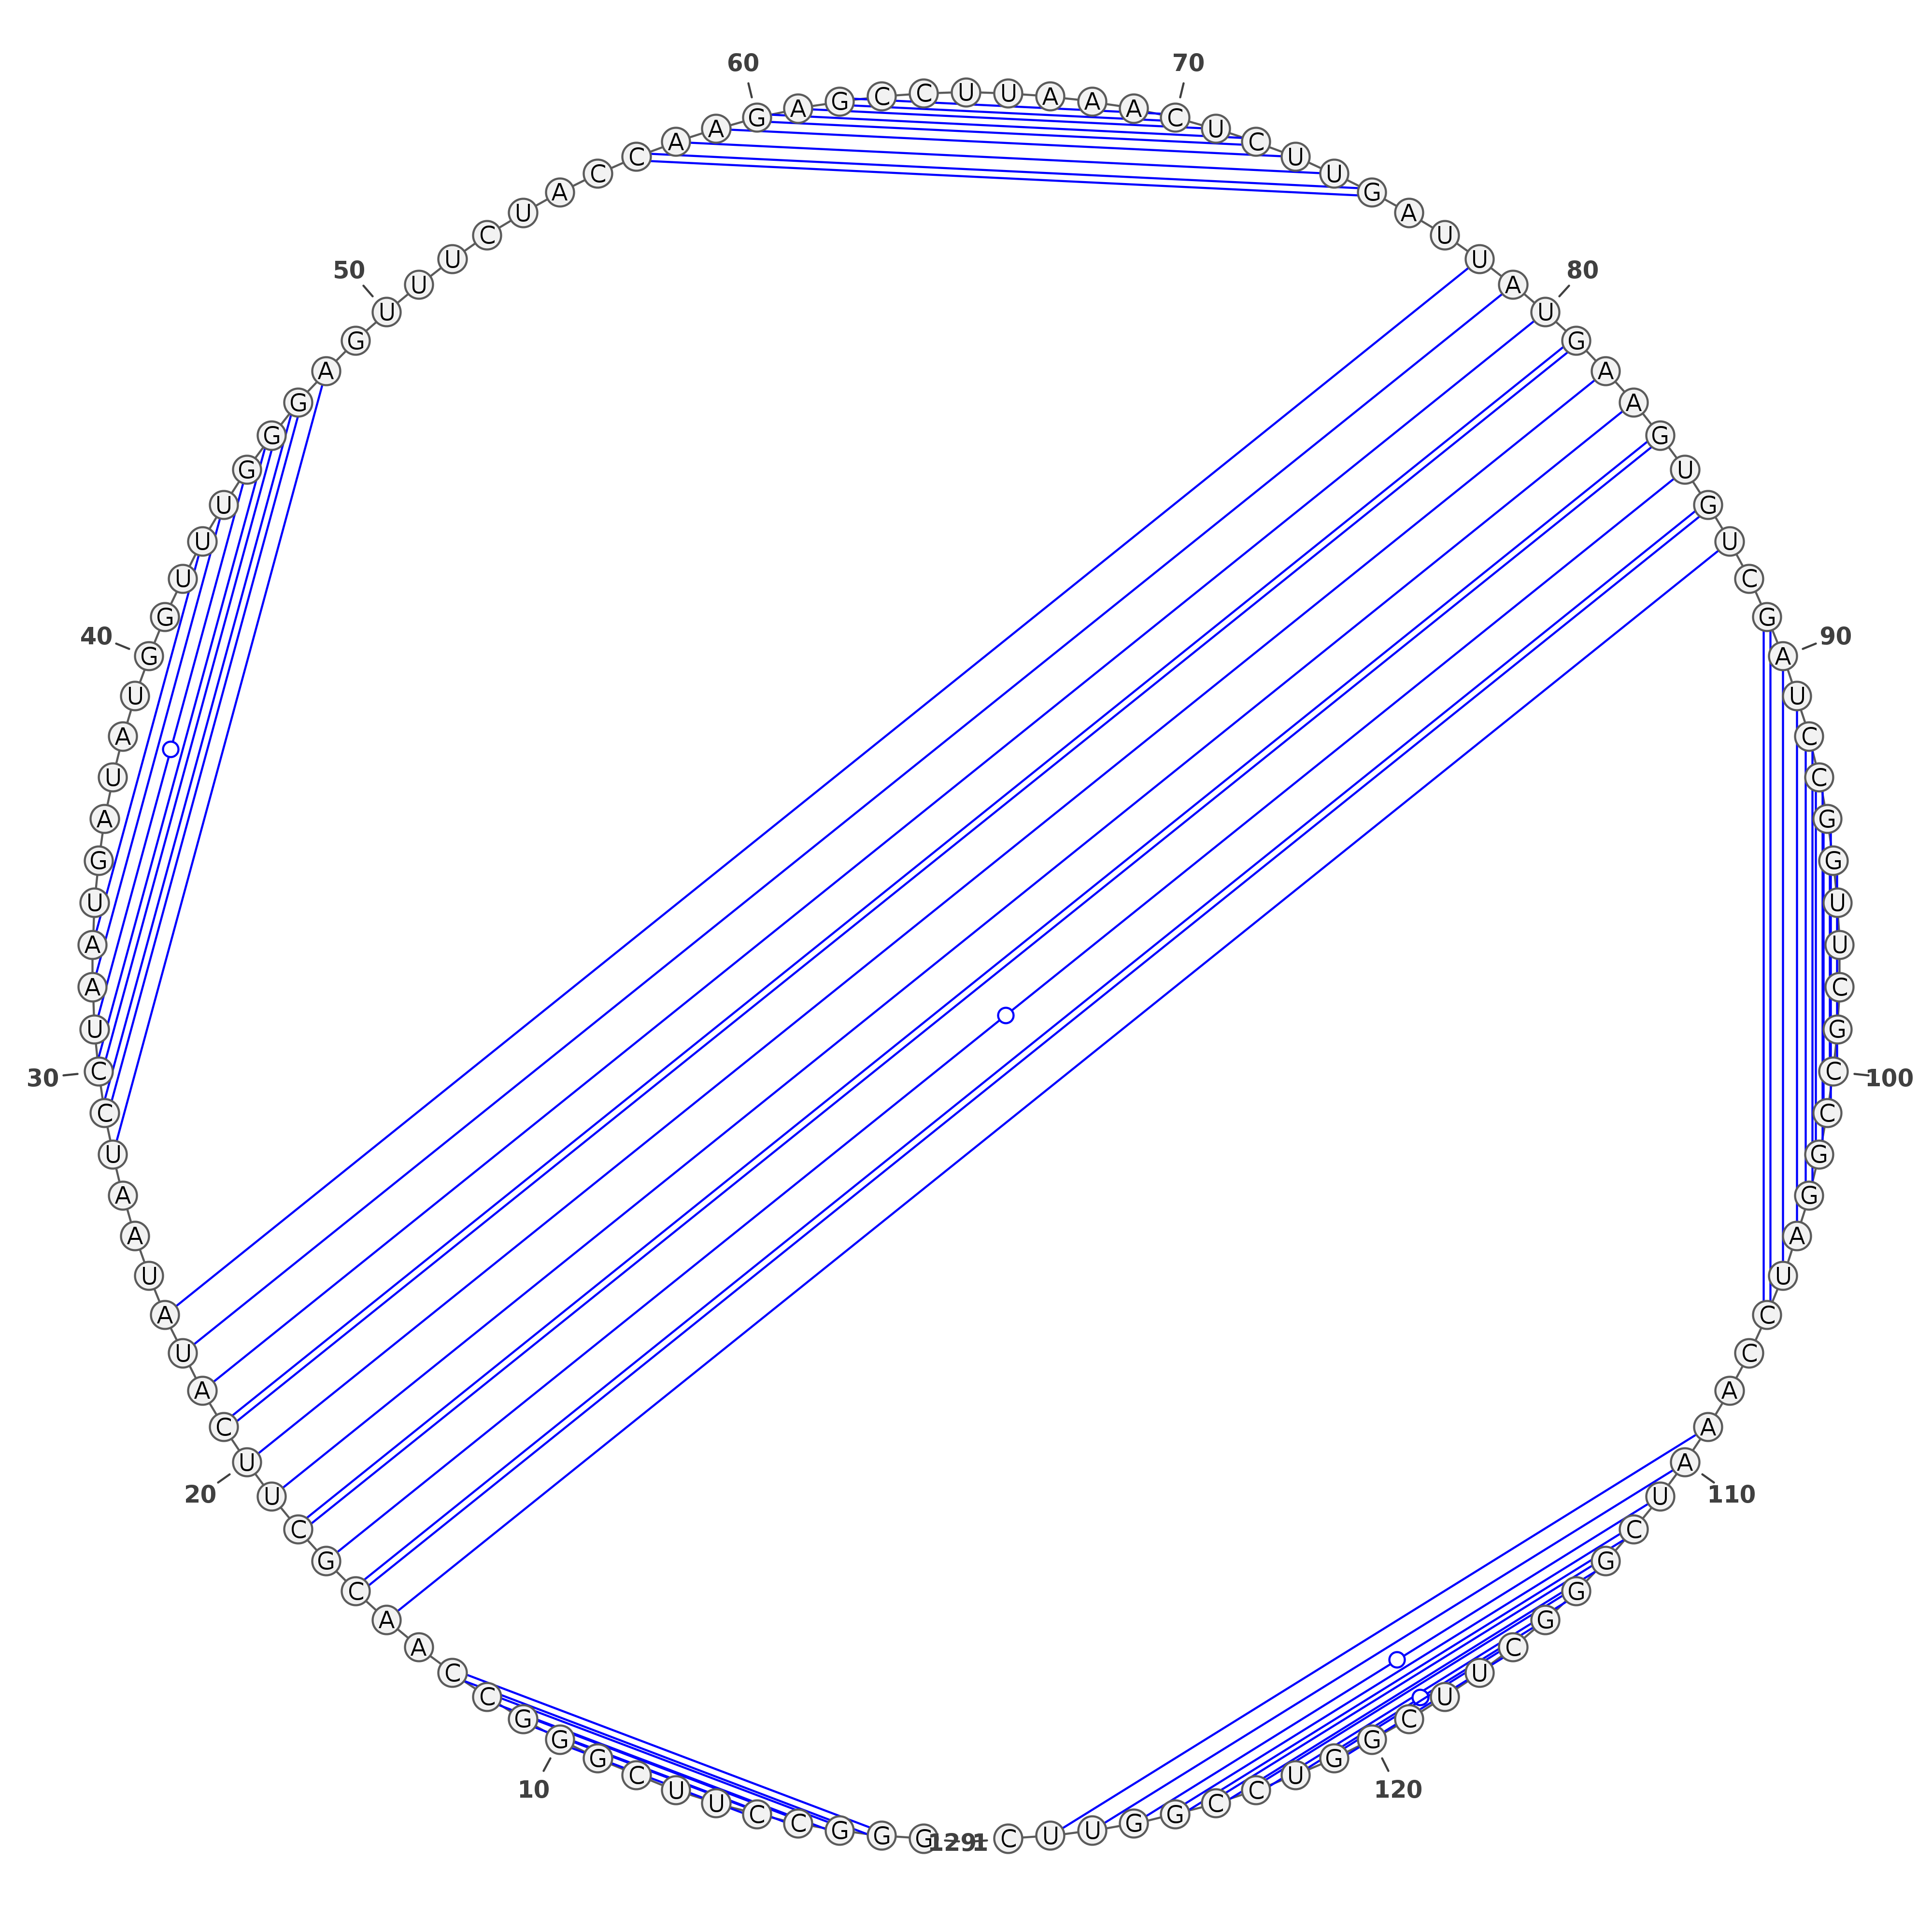
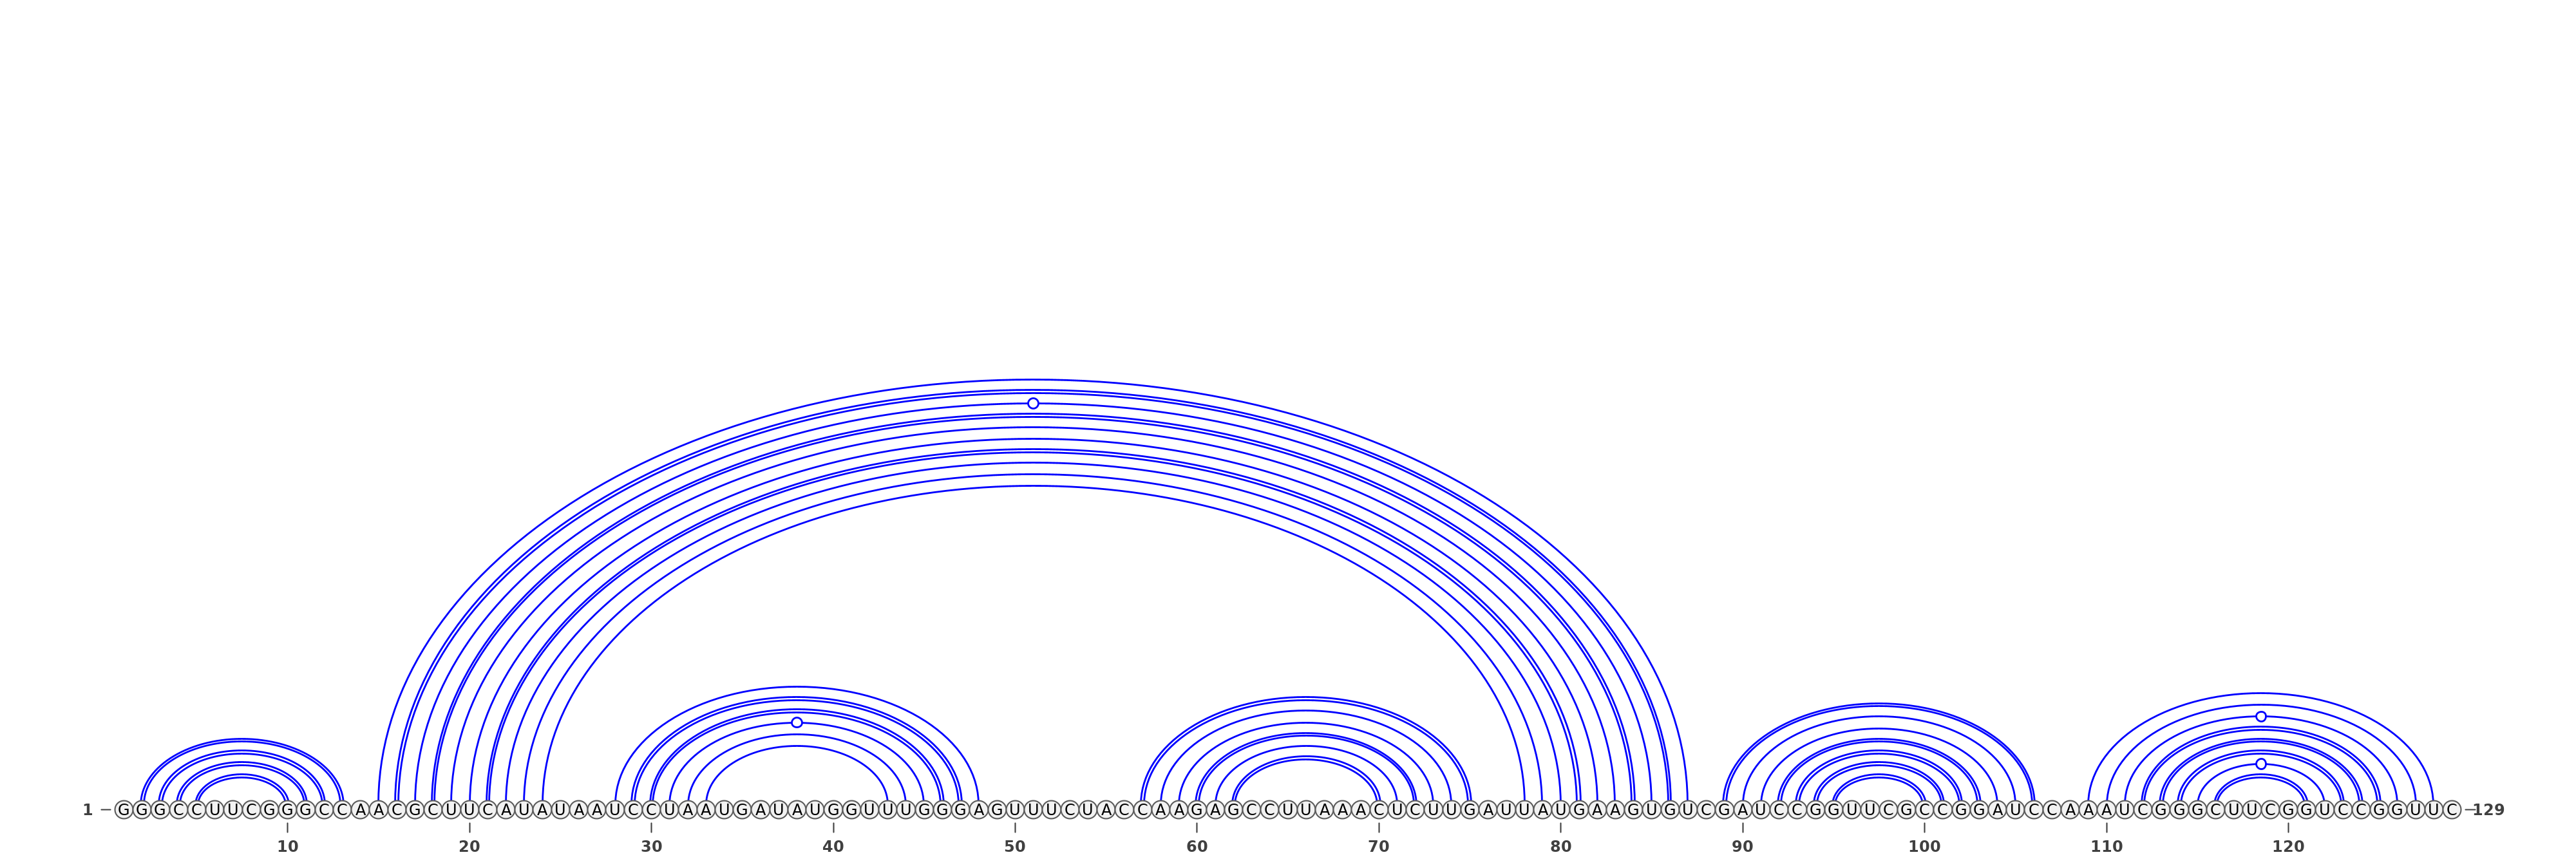
1. VARNA representations for SHAPE directed predictions
The predicted structures are represented using VARNA software [REF]. For each of the methods, the images with structures are as follows:
- SHAPE Mode
- DMS / CMCT Mode
- Prediction Mode
Three representations (using three different VARNA algorithms) for two types of predictions each: SHAPE directed RNAfold and SHAPE directed ShapeKnots. The colors of the nucleotides represent the reactivities values generated by the normalization protocol employed on the server.
Below are example structures for SHAPE directed RNAfold structures: (note that the secondary structures are exactly the same, only their representations are different):
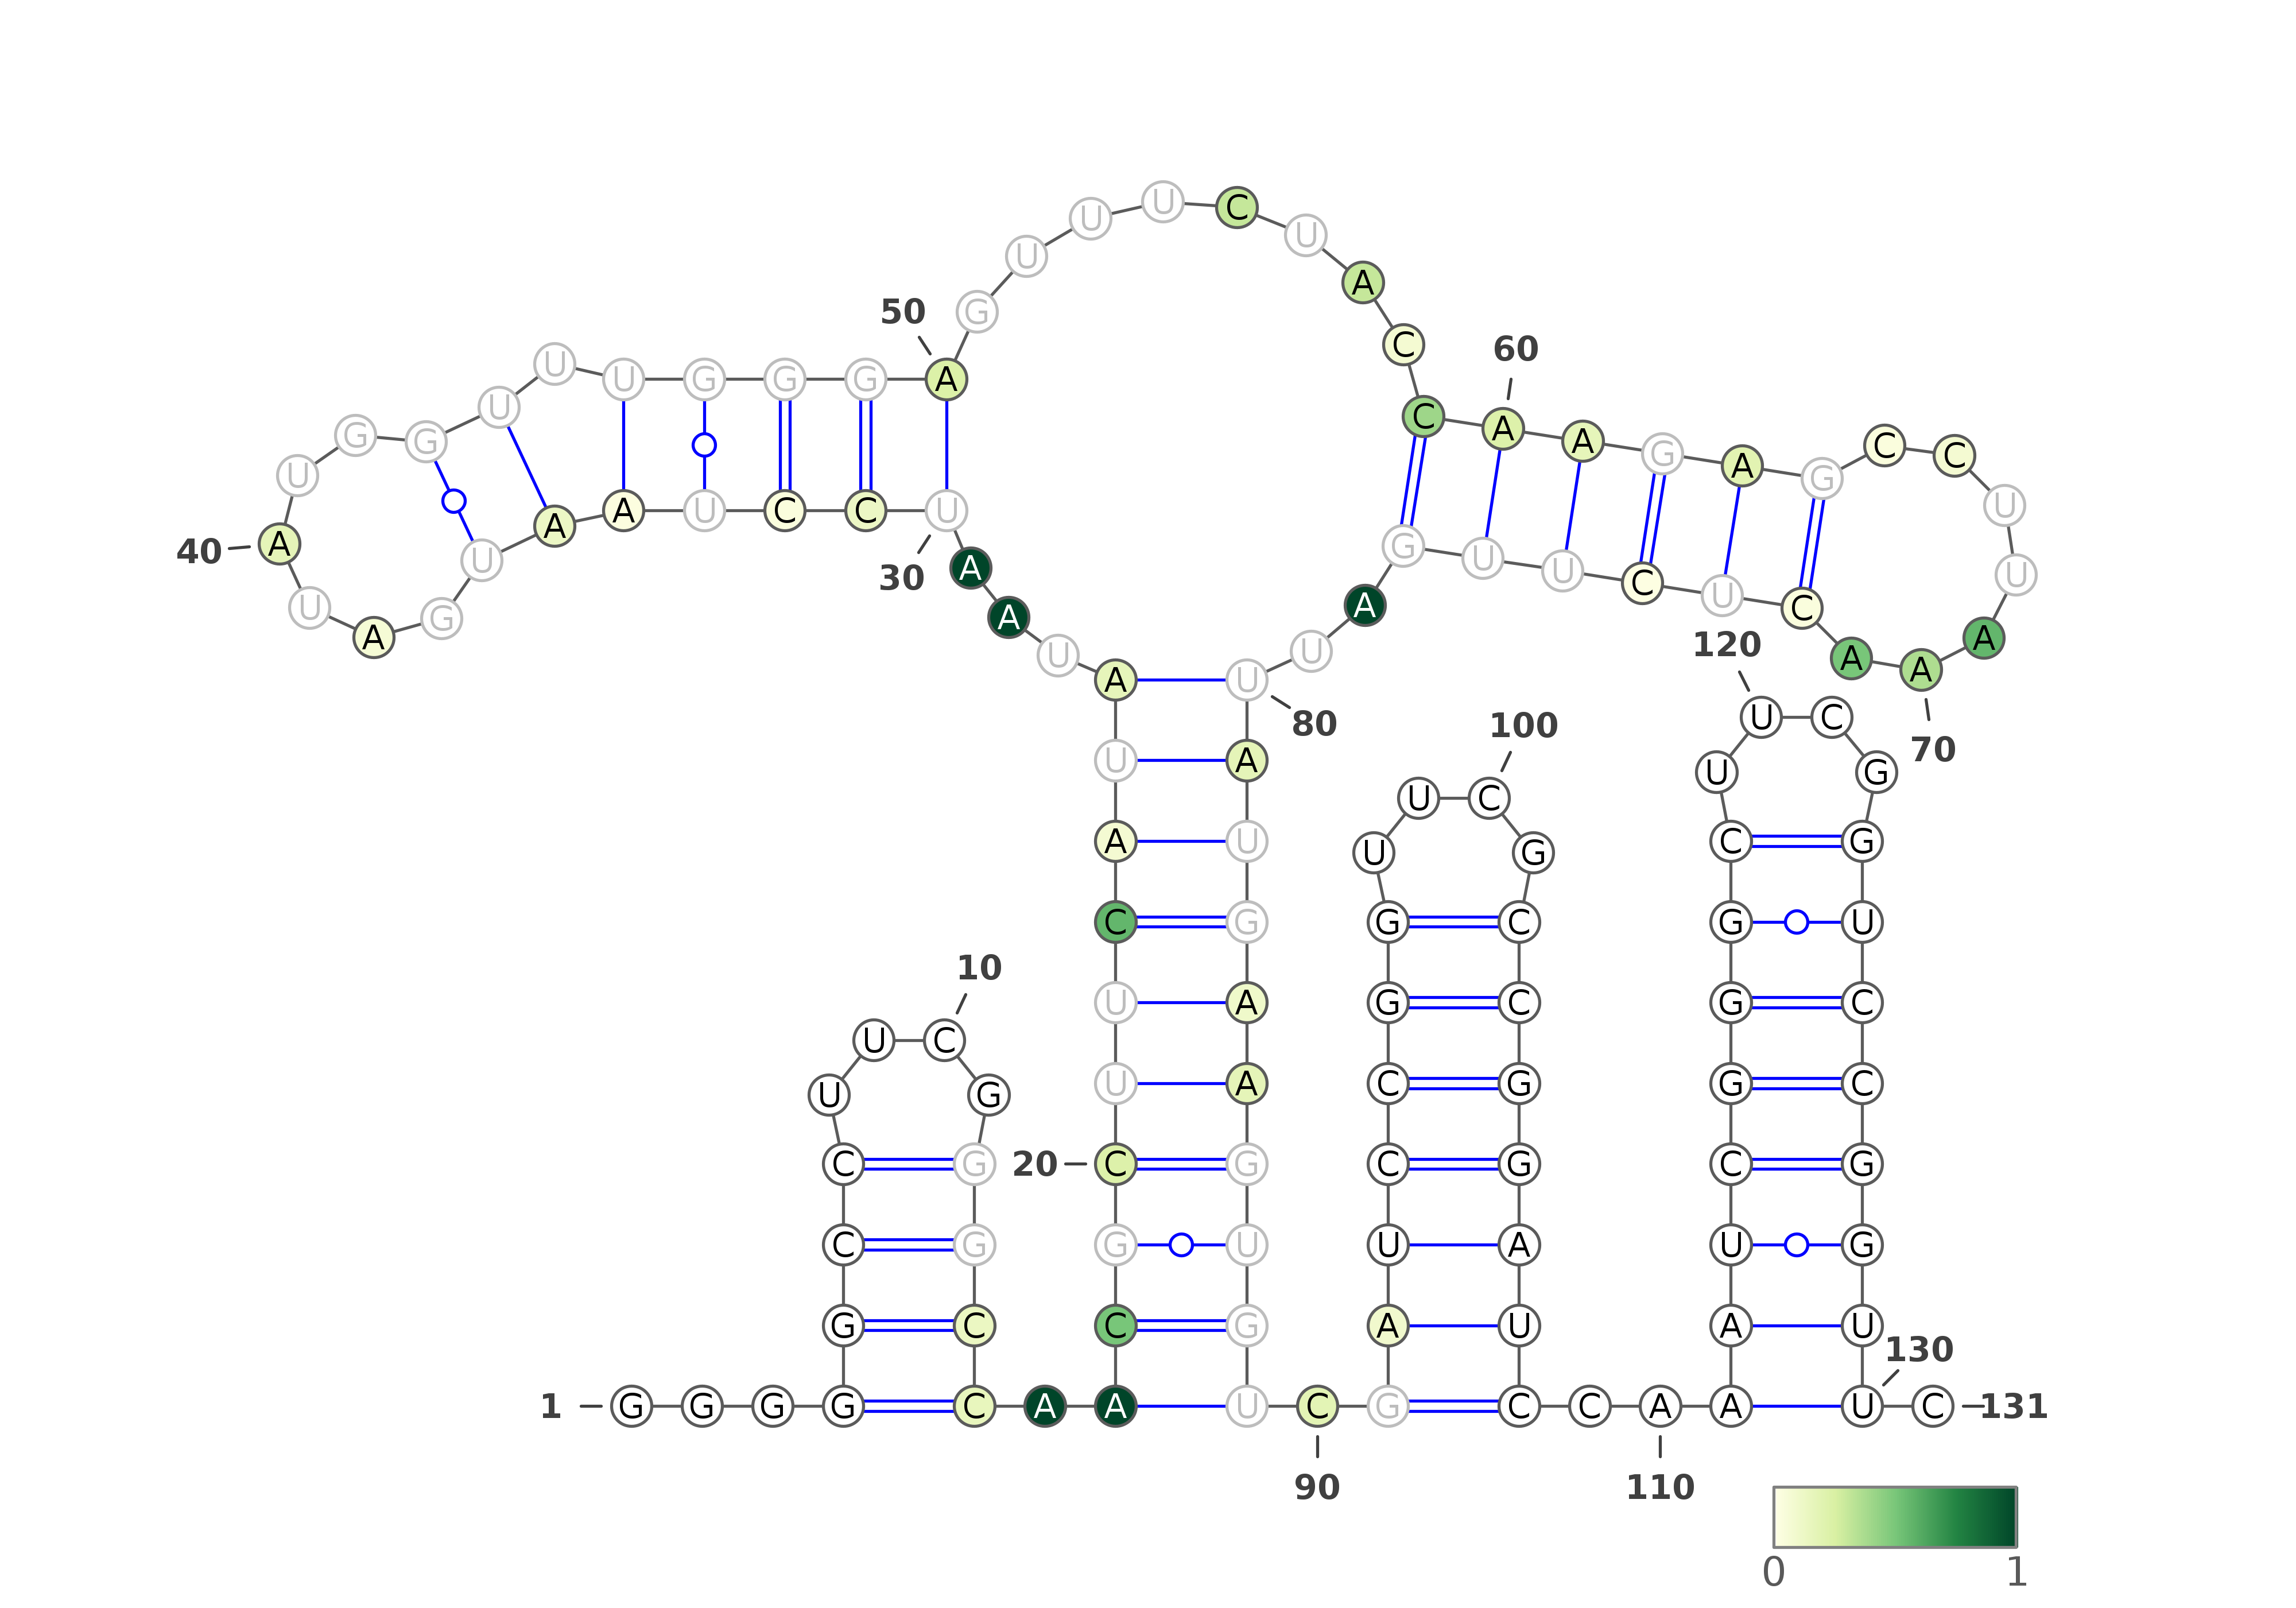
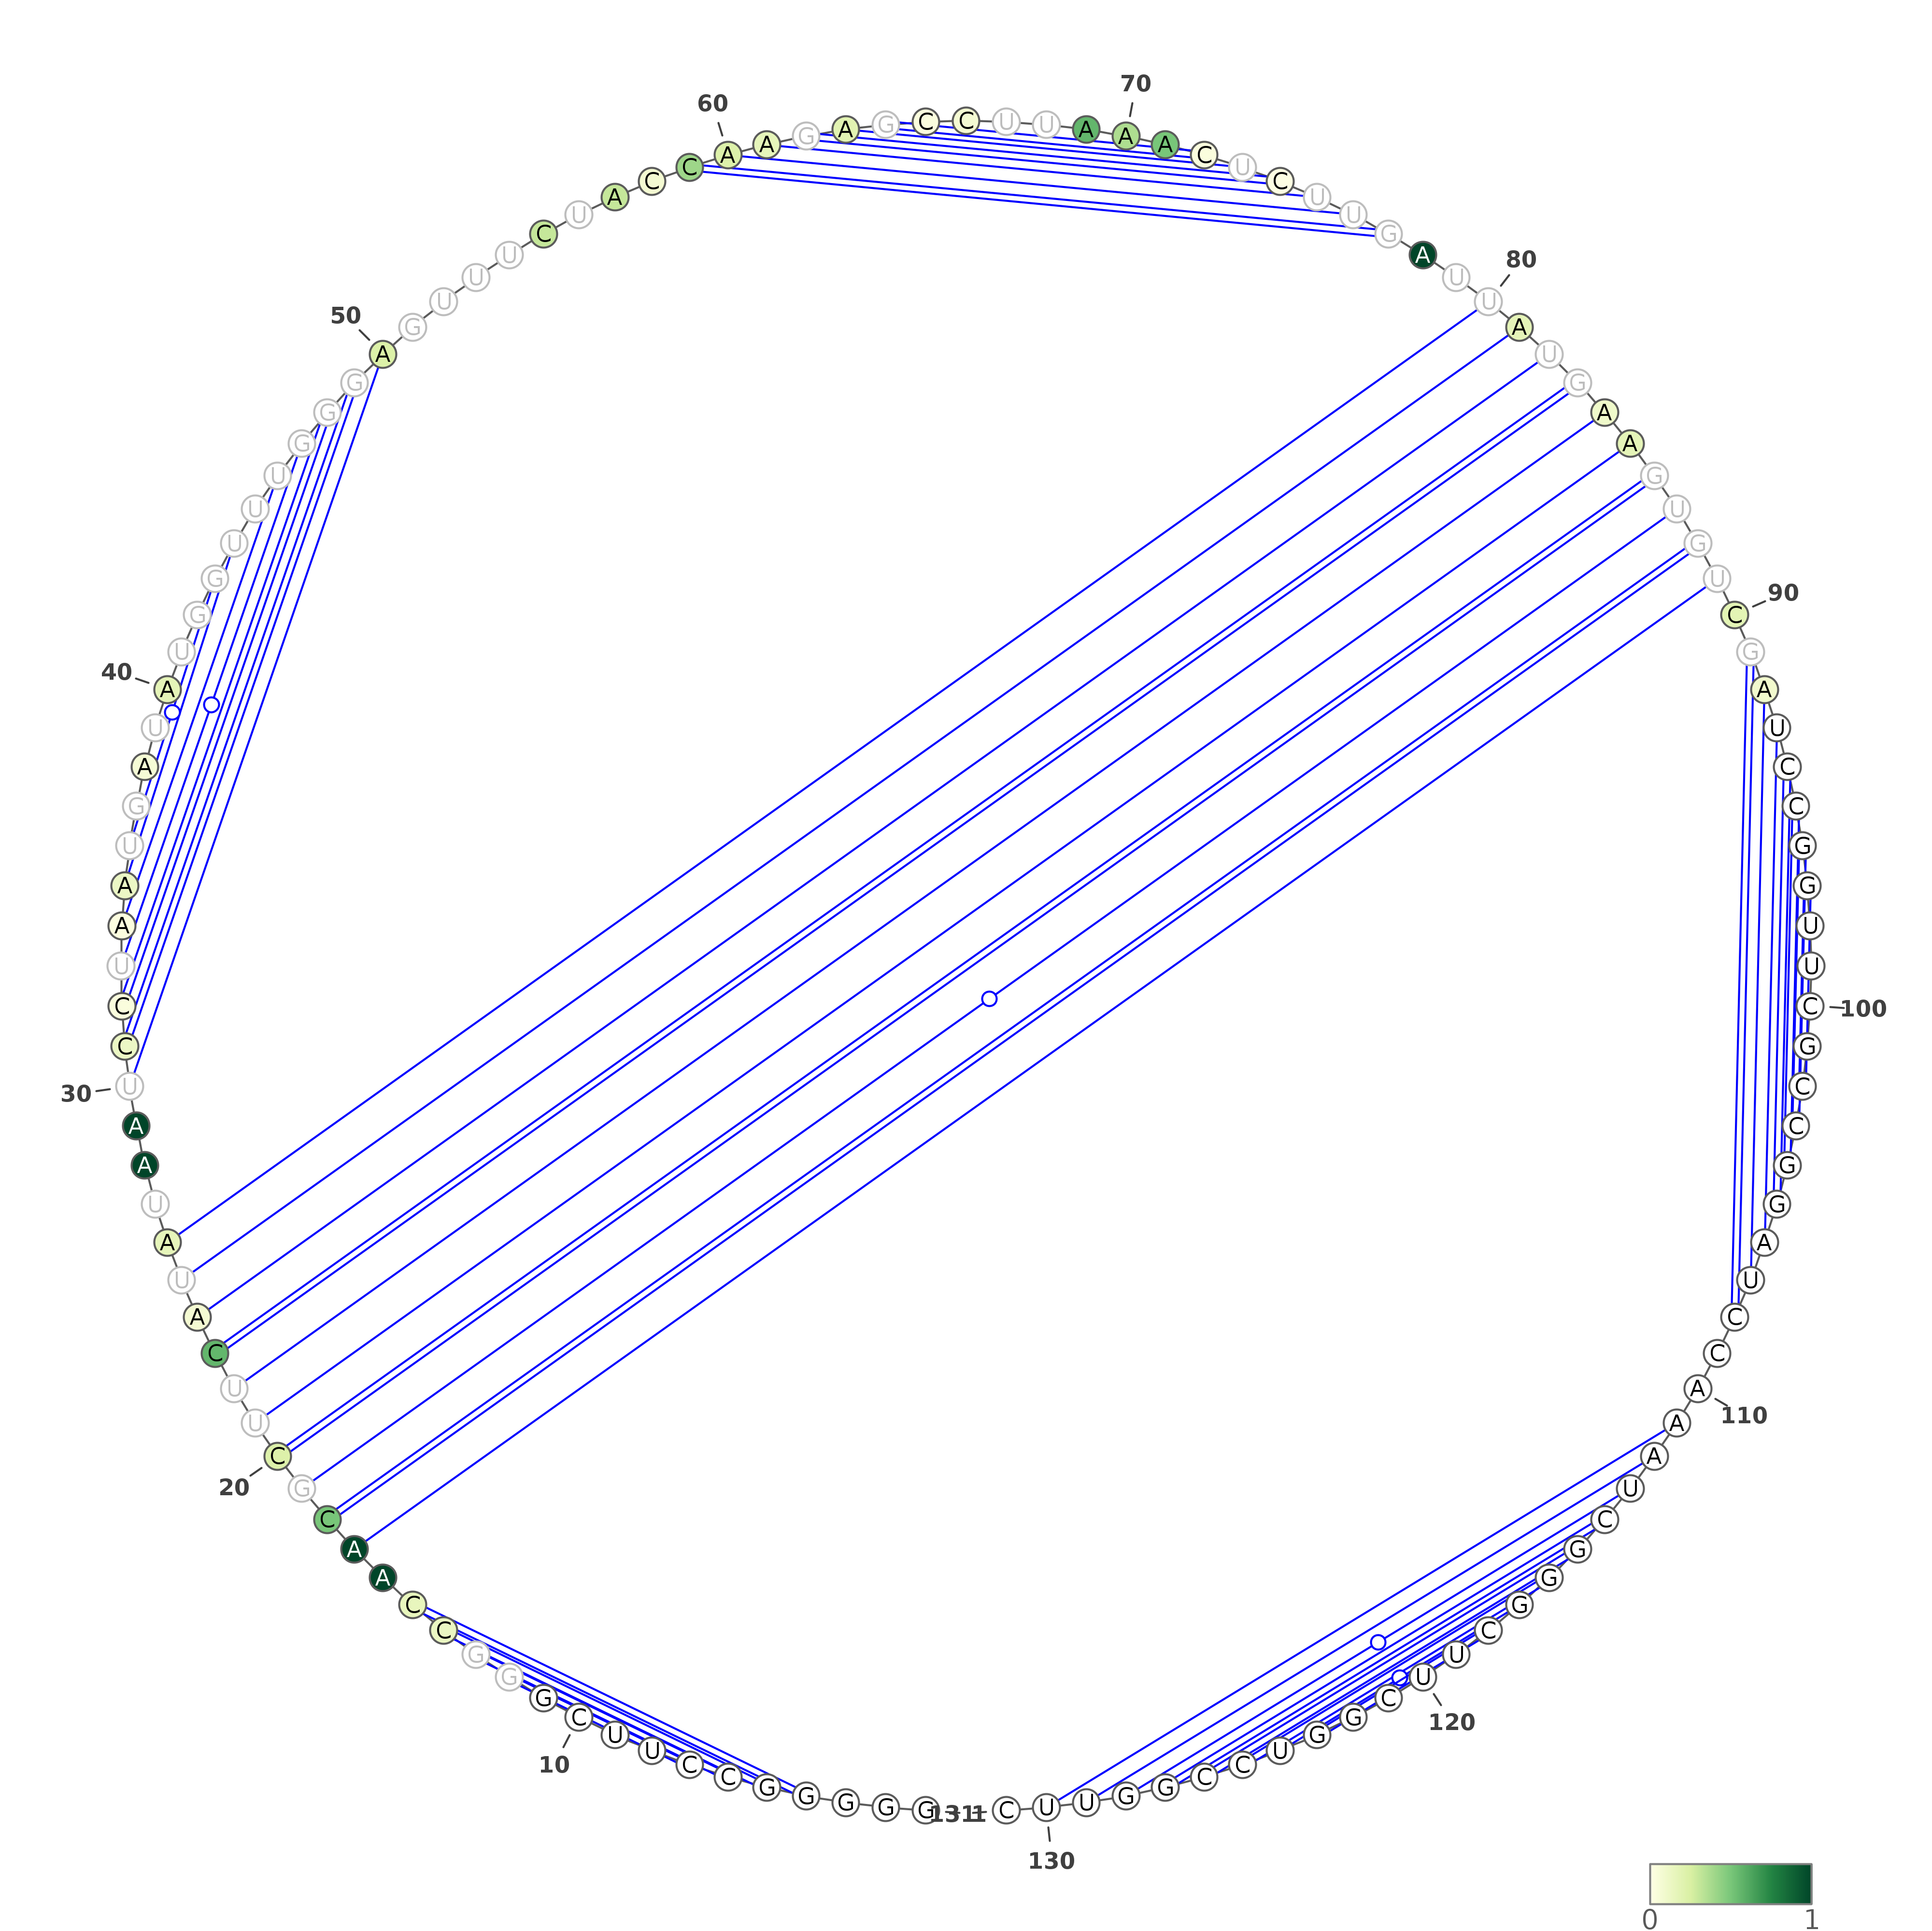
Three representations (using three different VARNA algorithms) for Probing directed Fold prediction. The colors of the nucleotides represent the reactivities values.
Below are example structures for DMS directed Fold structures (note that the secondary structures are exactly the same, only their representations are different):
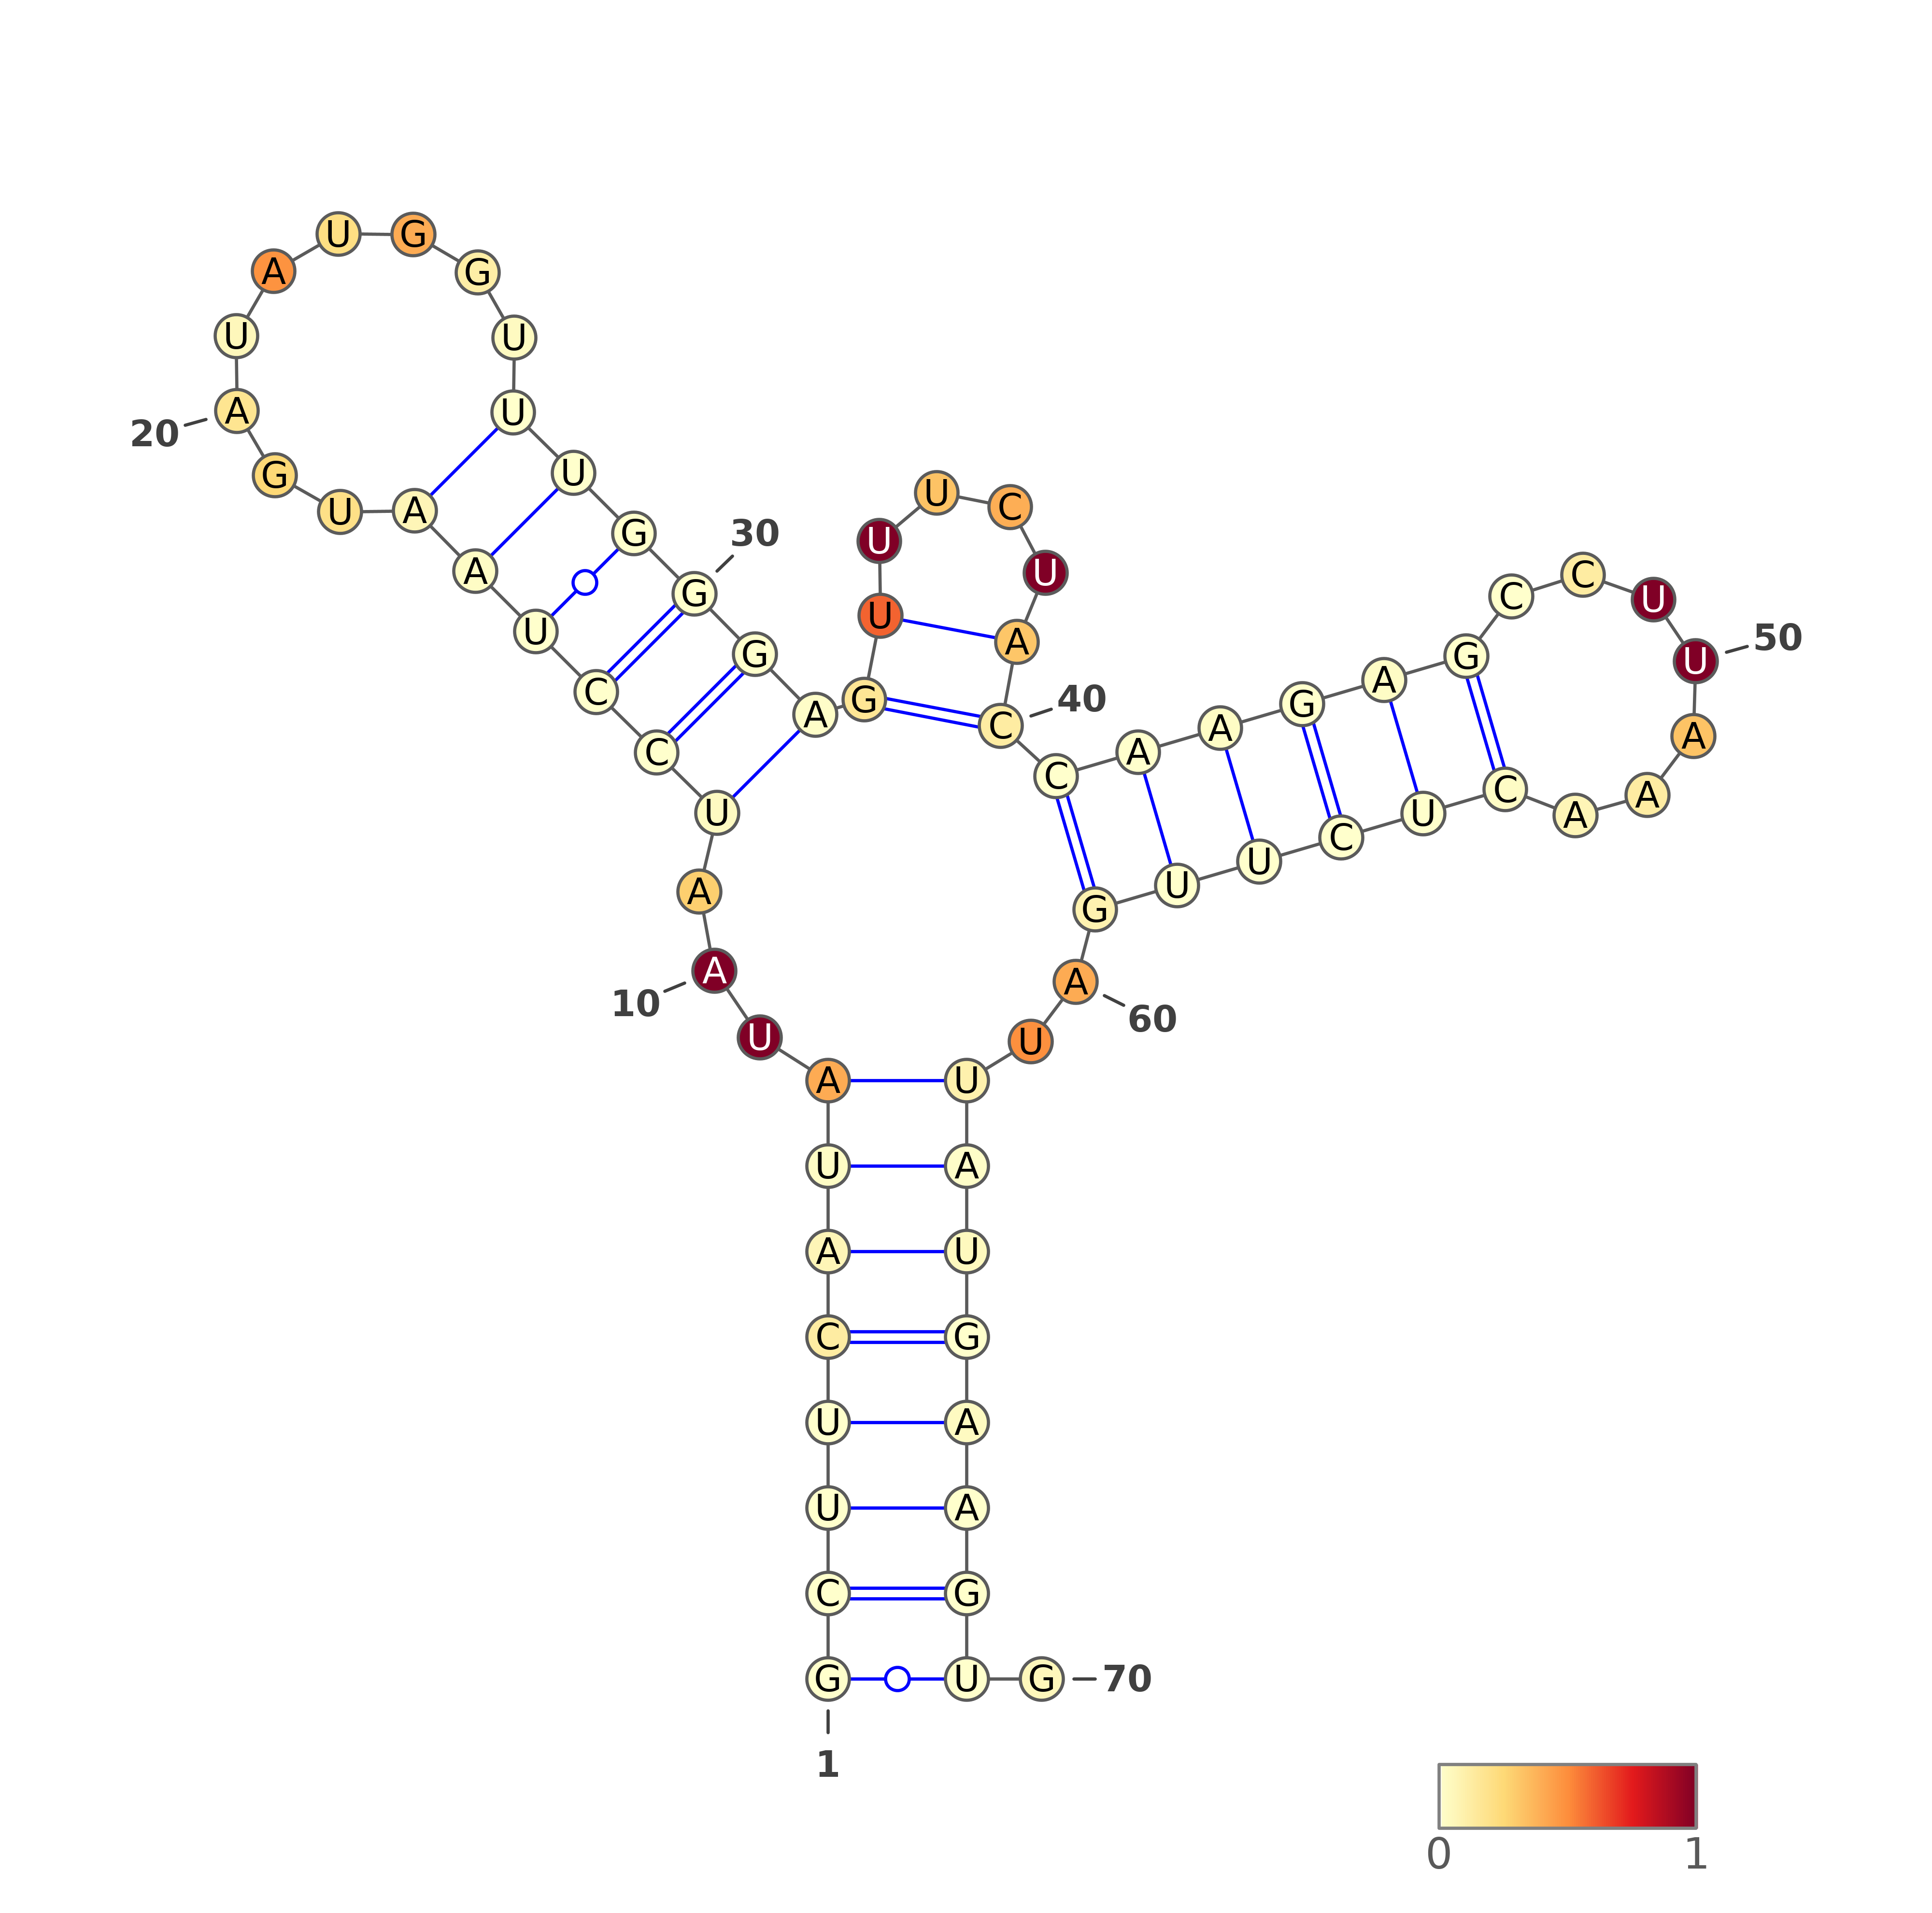
Three representations (using three different VARNA algorithms) for a structure being a consensus of all secondary structure predictions (generated by our in-house method).
Below are example structures for consensus structure (note that the secondary structures are exactly the same, only their representations are different):
2. XLSX/HTML table with all results
The table with all results are available in two forms: HTML viewed on the website, and XLSX for download. Both of the tables are identical. The table viewed on the website is scrollable. The table is divided into five main parts:
- Name - the name that user provided in the 'Name of the job:' box
- Method - lists the methods used to generate secondary structure
- Filenames - a combined name of the uploaded file, along with the analysis mode
- Full string - sequence/secondary structure, represented as a string, allowing the user to copy-paste it, depending on the needs.
- Sequence/reactivity/structure - in this part, information (the type of nucleotide, reactivity value, structure) for each nucleotide is placed in a separate cell. This feature is extremely useful in comparative analyses between experiments (e.g., repeats, controls, different RNA variants, etc.).
Below is an example result table:
| Name | Method | Filenames | Full string | ||||||||||||||||||||||||||||||||||||||||||||||||||||||||||||||||||||||
|---|---|---|---|---|---|---|---|---|---|---|---|---|---|---|---|---|---|---|---|---|---|---|---|---|---|---|---|---|---|---|---|---|---|---|---|---|---|---|---|---|---|---|---|---|---|---|---|---|---|---|---|---|---|---|---|---|---|---|---|---|---|---|---|---|---|---|---|---|---|---|---|---|---|
| Demo1_Adenine_Riboswitch_no_ligand_SHAPE_mode | Adenine_Riboswitch_Adenine_Riboswitch_no_ligand_QuSHAPE_01_shape_mode | GCUUCAUAUAAUCCUAAUGAUAUGGUUUGGGAGUUUCUACCAAGAGCCUUAAACUCUUGAUUAUGAAGUG | G | C | U | U | C | A | U | A | U | A | A | U | C | C | U | A | A | U | G | A | U | A | U | G | G | U | U | U | G | G | G | A | G | U | U | U | C | U | A | C | C | A | A | G | A | G | C | C | U | U | A | A | A | C | U | C | U | U | G | A | U | U | A | U | G | A | A | G | U | G | |
| Demo1_Adenine_Riboswitch_no_ligand_SHAPE_mode | Adenine_Riboswitch_Adenine_Riboswitch_no_ligand_QuSHAPE_01_shape_mode | 0.00 | 0.00 | 0.00 | 0.00 | 0.12 | 0.06 | 0.02 | 0.40 | 1.00 | 1.00 | 0.28 | 0.03 | 0.00 | 0.00 | 0.00 | 0.02 | 0.06 | 0.20 | 0.25 | 0.17 | 0.05 | 0.48 | 0.21 | 0.40 | 0.11 | 0.03 | 0.00 | 0.00 | 0.00 | 0.00 | 0.00 | 0.01 | 0.16 | 0.59 | 1.00 | 0.32 | 0.39 | 1.00 | 0.31 | 0.12 | 0.00 | 0.00 | 0.02 | 0.00 | 0.02 | 0.00 | 0.00 | 0.12 | 1.00 | 1.00 | 0.32 | 0.12 | 0.06 | 0.02 | 0.00 | 0.00 | 0.00 | 0.00 | 0.08 | 0.40 | 0.49 | 0.09 | 0.01 | 0.04 | 0.00 | 0.03 | 0.00 | 0.00 | 0.00 | 0.05 | ||
| Demo1_Adenine_Riboswitch_no_ligand_SHAPE_mode | RNAfold_SHAPE | Adenine_Riboswitch_Adenine_Riboswitch_no_ligand_QuSHAPE_01_shape_mode | ((((((((...((((((.........))))))((....))((((((.......))))))..)))))))). | ( | ( | ( | ( | ( | ( | ( | ( | . | . | . | ( | ( | ( | ( | ( | ( | . | . | . | . | . | . | . | . | . | ) | ) | ) | ) | ) | ) | ( | ( | . | . | . | . | ) | ) | ( | ( | ( | ( | ( | ( | . | . | . | . | . | . | . | ) | ) | ) | ) | ) | ) | . | . | ) | ) | ) | ) | ) | ) | ) | ) | . |
| Demo1_Adenine_Riboswitch_no_ligand_SHAPE_mode | ShapeKnots_SHAPE | Adenine_Riboswitch_Adenine_Riboswitch_no_ligand_QuSHAPE_01_shape_mode | ((((((((...((((((.........))))))........((((((.......))))))..)))))))). | ( | ( | ( | ( | ( | ( | ( | ( | . | . | . | ( | ( | ( | ( | ( | ( | . | . | . | . | . | . | . | . | . | ) | ) | ) | ) | ) | ) | . | . | . | . | . | . | . | . | ( | ( | ( | ( | ( | ( | . | . | . | . | . | . | . | ) | ) | ) | ) | ) | ) | . | . | ) | ) | ) | ) | ) | ) | ) | ) | . |
| Demo1_Adenine_Riboswitch_no_ligand_SHAPE_mode | RNAfold | ((((((((...((((((.........))))))........((((((.......))))))..)))))))). | ( | ( | ( | ( | ( | ( | ( | ( | . | . | . | ( | ( | ( | ( | ( | ( | . | . | . | . | . | . | . | . | . | ) | ) | ) | ) | ) | ) | . | . | . | . | . | . | . | . | ( | ( | ( | ( | ( | ( | . | . | . | . | . | . | . | ) | ) | ) | ) | ) | ) | . | . | ) | ) | ) | ) | ) | ) | ) | ) | . | |
| Demo1_Adenine_Riboswitch_no_ligand_SHAPE_mode | RNAStructure_Fold | ((((((((...((((((.........))))))........((((((.......))))))..)))))))). | ( | ( | ( | ( | ( | ( | ( | ( | . | . | . | ( | ( | ( | ( | ( | ( | . | . | . | . | . | . | . | . | . | ) | ) | ) | ) | ) | ) | . | . | . | . | . | . | . | . | ( | ( | ( | ( | ( | ( | . | . | . | . | . | . | . | ) | ) | ) | ) | ) | ) | . | . | ) | ) | ) | ) | ) | ) | ) | ) | . | |
| Demo1_Adenine_Riboswitch_no_ligand_SHAPE_mode | CentroidFold | ((((((((....(((((.........))))).........((((((.......))))))..)))))))). | ( | ( | ( | ( | ( | ( | ( | ( | . | . | . | . | ( | ( | ( | ( | ( | . | . | . | . | . | . | . | . | . | ) | ) | ) | ) | ) | . | . | . | . | . | . | . | . | . | ( | ( | ( | ( | ( | ( | . | . | . | . | . | . | . | ) | ) | ) | ) | ) | ) | . | . | ) | ) | ) | ) | ) | ) | ) | ) | . | |
| Demo1_Adenine_Riboswitch_no_ligand_SHAPE_mode | ContraFold | ((((((((..((((((((......).))))))((....))((((((.......)))))).))))))))). | ( | ( | ( | ( | ( | ( | ( | ( | . | . | ( | ( | ( | ( | ( | ( | ( | ( | . | . | . | . | . | . | ) | . | ) | ) | ) | ) | ) | ) | ( | ( | . | . | . | . | ) | ) | ( | ( | ( | ( | ( | ( | . | . | . | . | . | . | . | ) | ) | ) | ) | ) | ) | . | ) | ) | ) | ) | ) | ) | ) | ) | ) | . | |
| Demo1_Adenine_Riboswitch_no_ligand_SHAPE_mode | IPknot | ((((((((....(((((.........))))).........((((((.......))))))..)))))))). | ( | ( | ( | ( | ( | ( | ( | ( | . | . | . | . | ( | ( | ( | ( | ( | . | . | . | . | . | . | . | . | . | ) | ) | ) | ) | ) | . | . | . | . | . | . | . | . | . | ( | ( | ( | ( | ( | ( | . | . | . | . | . | . | . | ) | ) | ) | ) | ) | ) | . | . | ) | ) | ) | ) | ) | ) | ) | ) | . | |
| Demo1_Adenine_Riboswitch_no_ligand_SHAPE_mode | Linearfold_C | ((((((((...((((((.........))))))........((((((.......))))))..)))))))). | ( | ( | ( | ( | ( | ( | ( | ( | . | . | . | ( | ( | ( | ( | ( | ( | . | . | . | . | . | . | . | . | . | ) | ) | ) | ) | ) | ) | . | . | . | . | . | . | . | . | ( | ( | ( | ( | ( | ( | . | . | . | . | . | . | . | ) | ) | ) | ) | ) | ) | . | . | ) | ) | ) | ) | ) | ) | ) | ) | . | |
| Demo1_Adenine_Riboswitch_no_ligand_SHAPE_mode | Linearfold_V | ((((((((...((((((.........))))))........((((((.......))))))..)))))))). | ( | ( | ( | ( | ( | ( | ( | ( | . | . | . | ( | ( | ( | ( | ( | ( | . | . | . | . | . | . | . | . | . | ) | ) | ) | ) | ) | ) | . | . | . | . | . | . | . | . | ( | ( | ( | ( | ( | ( | . | . | . | . | . | . | . | ) | ) | ) | ) | ) | ) | . | . | ) | ) | ) | ) | ) | ) | ) | ) | . | |
| Demo1_Adenine_Riboswitch_no_ligand_SHAPE_mode | Consensus_from_predictions | ((((((((...((((((.........))))))........((((((.......))))))..)))))))). | ( | ( | ( | ( | ( | ( | ( | ( | . | . | . | ( | ( | ( | ( | ( | ( | . | . | . | . | . | . | . | . | . | ) | ) | ) | ) | ) | ) | . | . | . | . | . | . | . | . | ( | ( | ( | ( | ( | ( | . | . | . | . | . | . | . | ) | ) | ) | ) | ) | ) | . | . | ) | ) | ) | ) | ) | ) | ) | ) | . |
3. Heatmap and barplot
The heatmap and barplot images are available for all three Probing modes.
The heatmap plot represents the reactivity value for each nucleotide in a separate box. The heatmap plots may be useful in a comparison between experiments, and can be easily incorporated as an image for publication.
The barplot represents the reactivity value for each nucleotide in a generally recognized format used in publications. The reactivities are colored as follows: 0.0 to 0.3 - black, 0.3 to 0.7 - orange, 0.7 to 1.0 - red. In this representation, the user can easily spot which nucleotides are highly-reactive/non-reactive.


4. Text files with predictions
The server generates a series of textfiles with results, providing interoperability with bioinformatic workflows.
All predictions (txt file)( see the sample all predictions file)The file consists of the name of the computation, sequence and predicted secondary structures for all utilized pediction methods. his file can be easily incorporated in bioinformatic pipelines, with simple fetching relevant information out of it. The format of the file is as follows:
>Adenine_Riboswitch_no_ligand_QuSHAPE_01.txt
GCUUCAUAUAAUCCUAAUGAUAUGGUUUGGGAGUUUCUACCAAGAGCCUUAAACUCUUGAUUAUGAAGUG
((((((((...((((((.........))))))((....))((((((.......))))))..)))))))). RNAfold with SHAPE data
((((((((...((((((.........))))))........((((((.......))))))..)))))))). ShapeKnots with SHAPE data

((((((((...((((((.........))))))........((((((.......))))))..)))))))). RNAfold
((((((((...(((((((......).))))))........((((((.......))))))..)))))))). RNAstructure ProbKnot
((((((((...((((((.........))))))........((((((.......))))))..)))))))). RNAstructure Fold
((((((((....(((((.........))))).........((((((.......))))))..)))))))). CentroidFold
((((((((..((((((((......).))))))((....))((((((.......)))))).))))))))). CONTRAfold
((((((((....(((((.........))))).........((((((.......))))))..)))))))). IPknot
((((((((...((((((.........))))))........((((((.......))))))..)))))))). LinearFold C
((((((((...((((((.........))))))........((((((.......))))))..)))))))). LinearFold V
((((((((...((((((.........))))))........((((((.......))))))..)))))))). Consensus from predictions thrs 0.5
Reactivities (txt file) (
see the sample reactivities file)
The reactivities file is a text file with two columns, with a nucleotide number and its corresponding reactivity value. The format of the file is the same as used in the SHAPE directed predictions with RNAfold and ShapeKnots. Note, that this file is not available in Predict Mode.The format of the file is as follows:
1 0.03
2 1.0
3 1.0
4 1.0
5 1.0
6 0.06
7 0.2
8 0.25
...
5. PDB file output
Standard PDB file, with modified B-factor according to the reactivity values. You can use it in any structure viewer that enables coloring by B-factor, and enjoy your mapped reactivities!